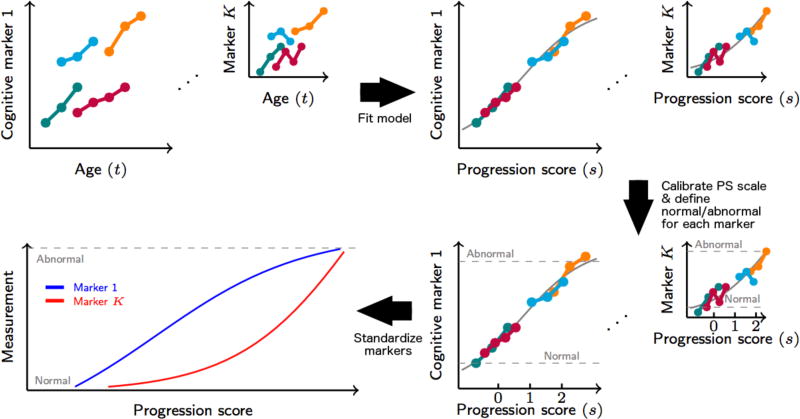
Figure 1.
Diagram illustrating progression score (PS) model fitting, PS calibration, and cognitive measurement scaling to obtain standardized space of cognitive markers. Lower values for the illustrated cognitive markers indicate lower cognitive performance. PS values are calibrated such that lower progression scores indicate better overall cognitive performance.

