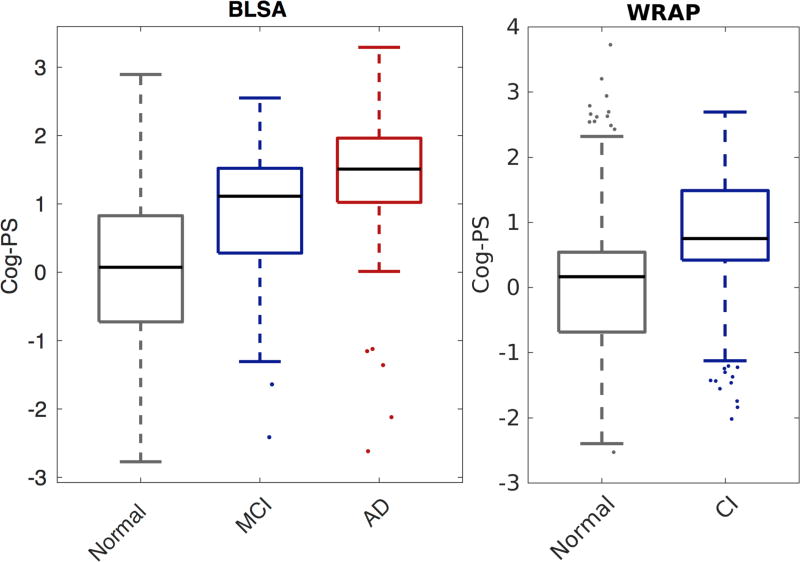
Figure 4.
Box plot of Cog-PS by clinical diagnosis at last visit in BLSA (left) and WRAP (right). Central mark is the median, edges of the box correspond to the interquartile range, and whiskers extend to the range of non-outlier Cog-PS values. Outliers are plotted individually. All pairwise group comparisons were significant within each data set (two-sided Wilcoxon rank-sum test, p < 0.0004).

