
Figure 4.
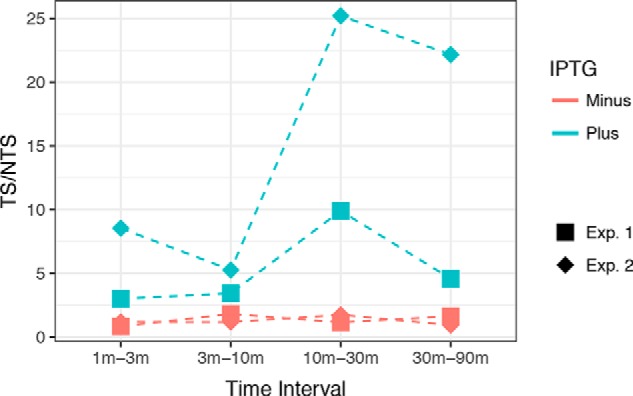
Time-course subtractive analysis of the TS/NTS in lacZ gene. Results were obtained with E. coli uvrD− phr− cells irradiated with 60 J/m2 UV and allowed to repair for 1, 3, 10, 30, and 90 min. On the y axis, each data point represents a TS/NTS value derived from the change in reads seen at successive time points. The x axis shows the time intervals; for example, the initial time-point (1 min) reads were subtracted from 3-min reads to obtain the reads plotted for the 1-min to 3-min time interval. Each data point from two experiments (Exp. 1 and Exp. 2) is plotted separately. Blue and red colors indicate plus and minus IPTG induction, respectively.