Figure 3.
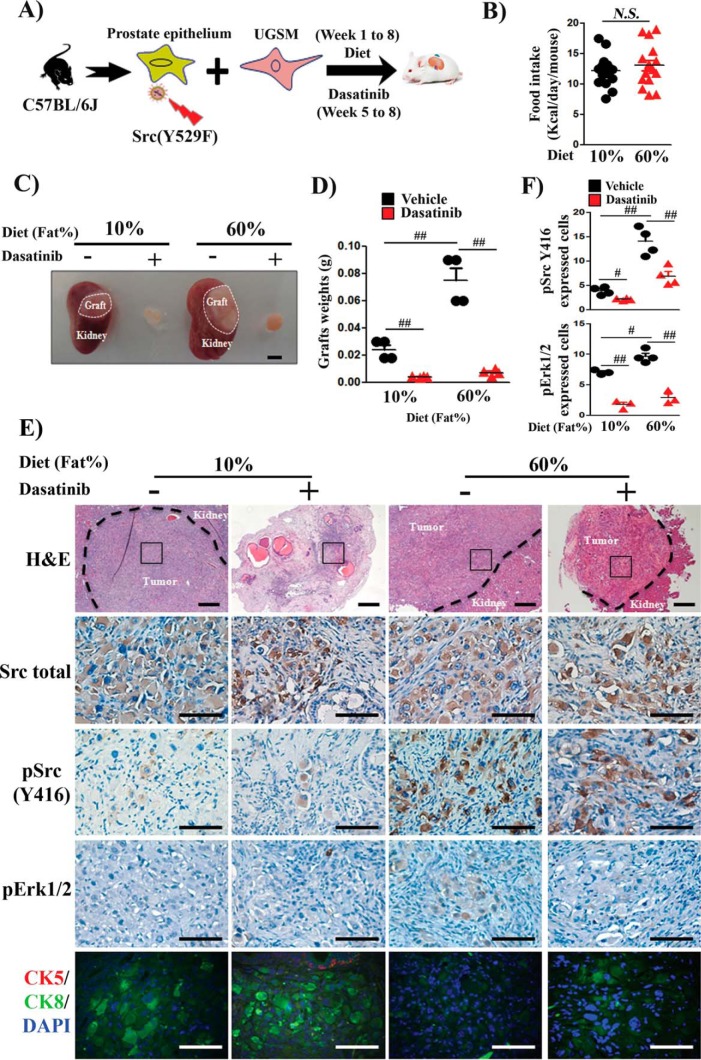
Dietary fat accelerates Src-induced prostate tumor progression. A, schematic of the in vivo prostate regeneration assay. Host SCID mice carrying Src(Y529F)-transduced regeneration tissues were placed on a 10% or 60% fat diet for 8 weeks and treated with vehicle or dasatinib from week 5 to week 8 (n = 4/group). UGSM, urogenital sinus mesenchyme. B, total calorie intake was not significantly different between the diet groups. C, representative images of regenerated prostate tumors. The dashed lines show the regenerated prostate grafts on the kidney (scale bar = 4 mm). D, prostate tumor weight from A represented as mean ± S.E. (n = 4/group). Asterisks indicate unpaired, two-tailed t test. E, representative H&E (panoramic view, scale bars = 400 μm) and IHC staining (selected tumorigenic region, scale bars = 100 μm) of total Src, pSrc(Tyr-416), and pErk1/2 and co-staining of CK5, a basal epithelial cell marker, CK8, a luminal epithelial cell marker, and DAPI of tumors from C. F, the expression levels of pSrc and pErk were analyzed in IHC samples based on image analysis. #, p < 0.05; ##, p < 0.01; N.S., not significant.

