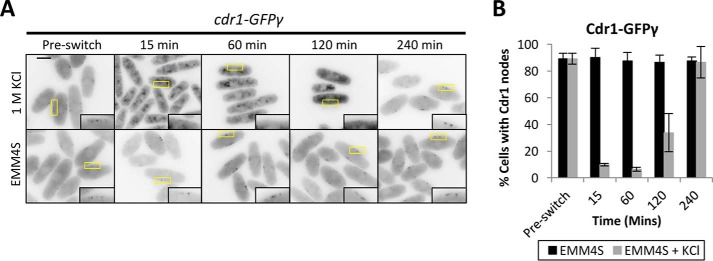
Figure 2.
Cdr1 exits nodes during osmotic stress. A, inverted contrast single focal plane images of Cdr1-GFPγ grown in EMM4S to mid-log phase and then split into medium containing 1 m KCl or into control medium (EMM4S). Insets are enlarged images of the medial cortex; yellow boxes indicate the enlarged area. Scale bar = 5 μm. B, quantification of cells containing Cdr1 localization to nodes (n > 100 cells for each time point; error bars represent standard deviation).

