Figure 3.
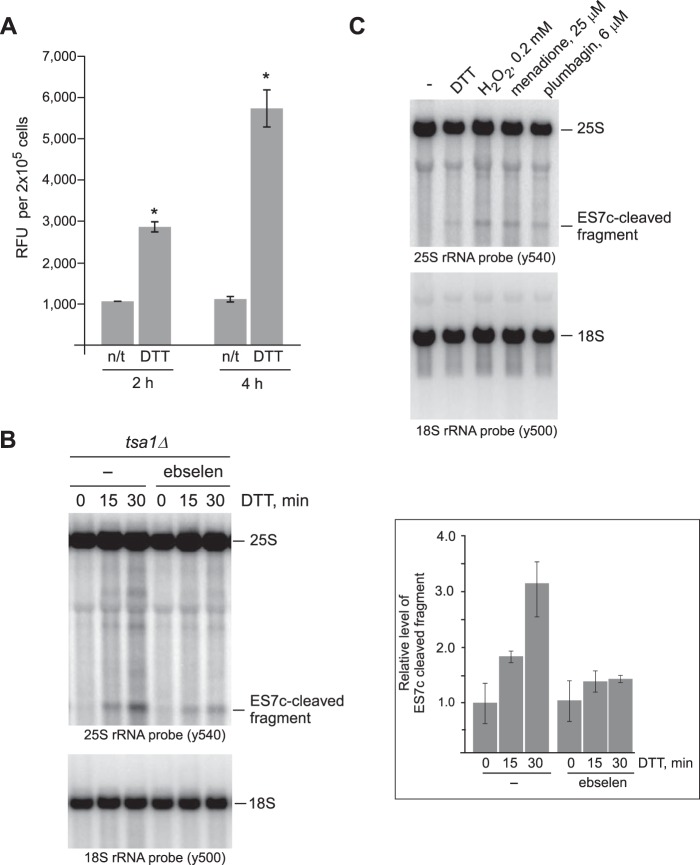
ES7c cleavage occurs in response to H2O2. A, mid-log wild-type cells grown in YPDA were treated with 20 mm DTT for 2 or 4 h or left untreated (n/t). The relative amounts of H2O2 present in treated and untreated cells were determined using an Amplex Red assay: an equal number of cells (1 × 10⁶) from each culture was collected, washed, and incubated in 500 μl of the assay buffer for 30 min at 30 °C to allow H2O2 release; 100 μl of the supernatant was used per reaction. The data show mean relative fluorescence units (RFU) in triplicate samples; the error bars represent S.D. The differences between the treated and untreated samples were significant. *, p < 0.01, unpaired two-tail t test. B, overnight tsa1Δ cultures were diluted with YPDA to an A600 of ∼0.2 and grown for 3 h. One half of the culture was pretreated with 10 μm ebselen for 1 h, whereas the other was left untreated (−). 20 mm DTT was added to both cultures, and the cells were harvested at the indicated time points. RNA extracted from cells was analyzed by Northern hybridizations with the indicated rRNA probes. The hybridization signal corresponding to the ES7c-cleaved rRNA fragment was converted to phosphorimaging units and normalized to the 18S rRNA signal in the same lane. The data on the graph show the mean values from three independent experiments; the error bars represent S.D. C, wild-type cells were diluted with YPDA to an A600 of ∼0.2, grown for 4 h, and treated for 2 h with 20 mm DTT, 25 μm menadione, 6 μm plumbagin, or left untreated (−). Treatment with 0.2 mm inorganic H2O2 was for 30 min. RNA was analyzed by Northern hybridization as in Fig. 1A.

