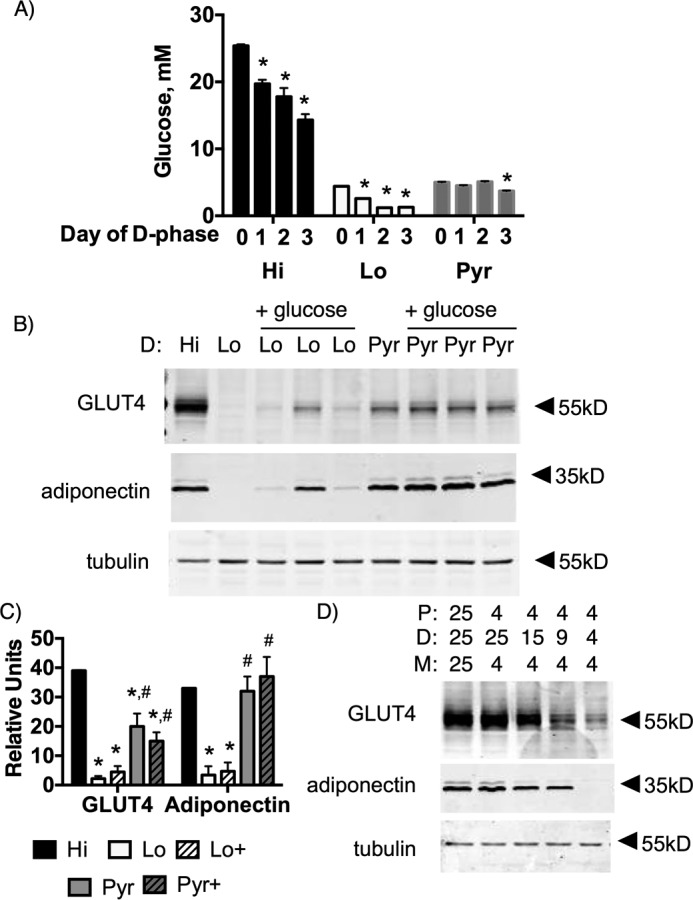
Figure 3.

4 mm glucose does not inhibit differentiation as a result of glucose starvation. A, glucose concentration in medium on days 0, 1, 2, and 3 of the D phase. *, p < 0.001 for n = 4 independent experiments, a significant difference from day 0 glucose concentration. One-way analysis of variance was used to identify significant differences in glucose concentration. 3T3-L1 cells were grown in 4 mm glucose and pulsed with 4 mm glucose (Lo), 25 mm glucose (Hi) or 4 mm glucose + 42 mm pyruvate (Pyr) during the D phase. Glucose was added (+glucose) on day 2 to restore glucose levels at starting concentrations. B, a representative cohort. C, quantification of three replicates of the cohort. Data were analyzed by one-way analysis of variance (p < 0.05 for n = 3 independent cohort experiments. *, significant difference compared with Hi glucose cells; #, significant difference compared with Lo glucose cells. D, glucose pulse dose response during D phase. Protein from whole-cell lysates of day 9 adipocytes were separated via SDS-PAGE and immunoblotted for GLUT4, adiponectin, and tubulin in both B and D.
