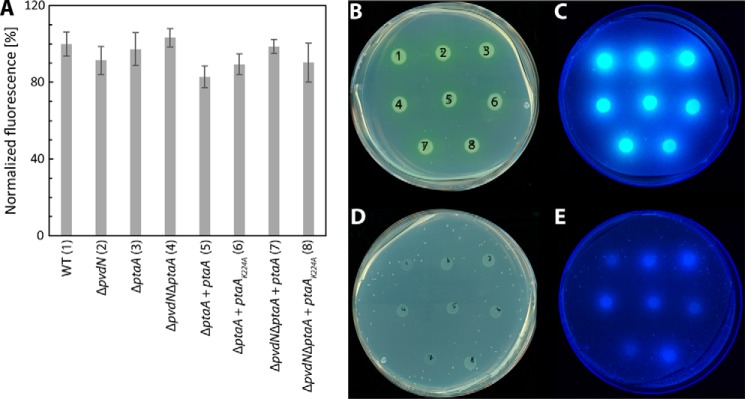
Figure 4.
Semiquantitative pyoverdine production and iron binding assay for all P. fluorescens A506 strains used in this study. A, relative quantification of pyoverdine production in liquid culture, normalized to P. fluorescens A506 (WT) levels. The error bars indicate the standard deviation calculated from triplicates. B–E, droplet assays of all P. fluorescens A506 strains used in this study as indicated by numeric notation (1–8) in A. The incubation was performed either in the absence (B and C) or presence of EDDHA (D and E). The same plates were scanned (B and D), or fluorescence was detected on a UV table (C and E).

