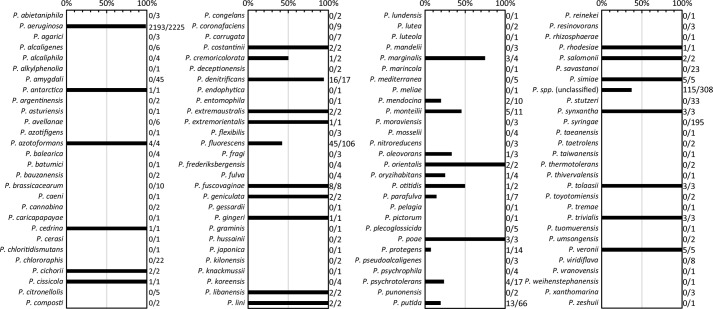
Figure 7.
Distribution of PtaA homologs within the genus Pseudomonas. Shown is an evaluation of the distribution of PtaA within the genus Pseudomonas. Numbers to the right of the bar graph indicate the ratio between genomes positive for the presence of PtaA and the total number of analyzed genomes of the respective species.

