
Fig. 4.
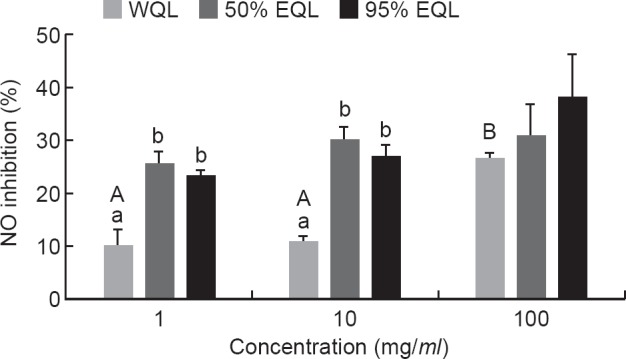
- The effect of the crude extracts on the NO production of the RAW 264.7 cells. After pre-treatment of the cells with different concentrations of the crude extracts (1,10 and 100 pglml) for 1-h, then the 1 pglml LPS was added to the cells for 24-h. Values are means ± SEM (n = 3). Different letters showed statistically significant differences (p < 0.05) among three extracts (lower case letters) and among three concentrations (capital letters) as analyzed by one-way ANOVA followed by Duncan’s test. WQL = water extract of quinoa leaves; 50% EQL = 50% ethanolic extract of quinoa leaves; 95% EQL = 95% ethanolic extract of quinoa leaves.