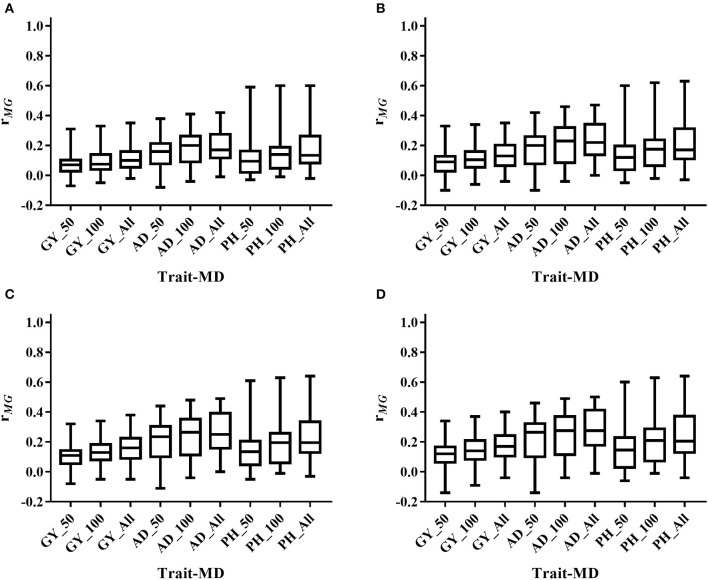
Figure 4.
Distribution of rMG across all the populations for all the target traits evaluated under WS condition under all the possible training population size (TPS) and marker density (MD) combinations. (A) TPS = 30; (B) TPS = 50; (C) TPS = 70; (D) TPS = 90. Three levels of MD, i.e., 50 SNPs, 100 SNPs and All SNPs, were used for prediction.

