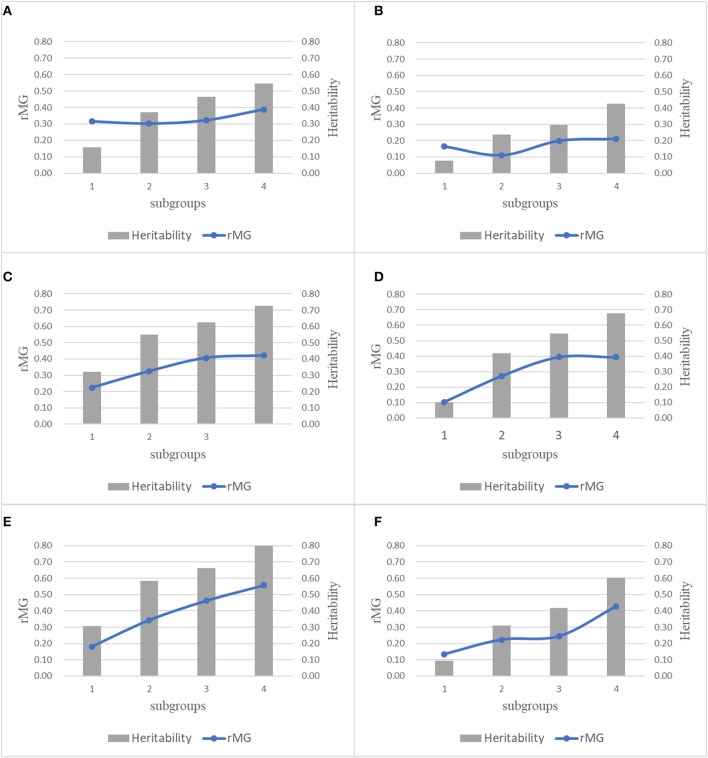
Figure 5.
Combination plot of rMG and h2 of all the 6 trait-environment combinations, all the 22 populations were divided into 4 subgroups sorted by the h2 of target traits from low to high, mean rMG of each subgroup was estimated under combinations of TPS = 90 and MD = All SNPs. (A) GY_WW; (B) GY_WS; (C) AD_WW; (D) AD_WS; (E) PH_WW; (F) PH_WS.

