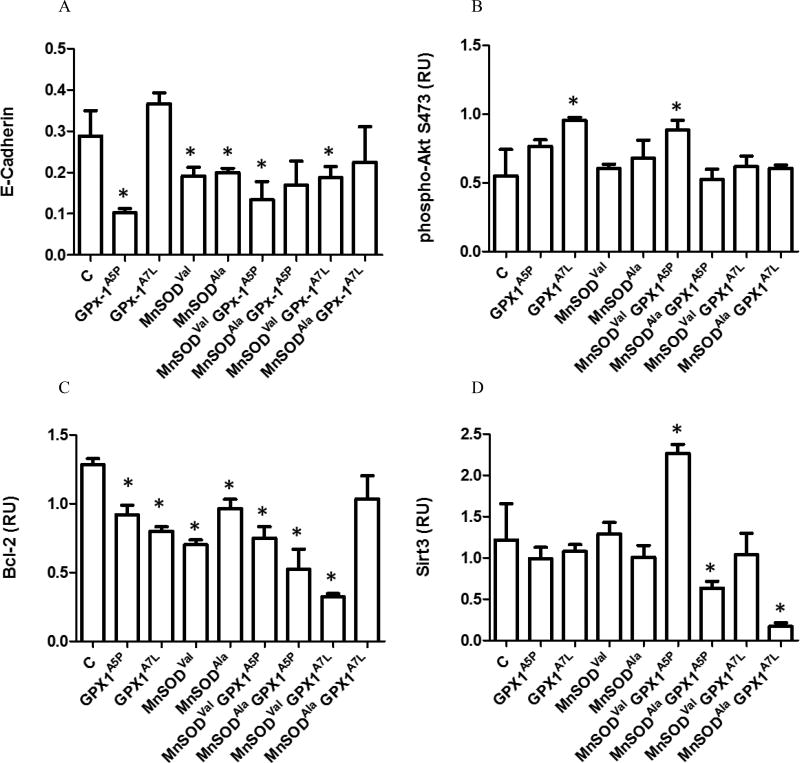
Figure 2. The effects of the expression of GPX1 and MnSOD on the levels of E-Cadherin, p-Akt, Bcl-2 and Sirt3.
Lysates from MCF-7 cells transfected with the empty vector (C), GPX1, MnSOD allele-specific constructs were analyzed for selected protein levels by western blot using protein-specific antibodies. β-Actin was used as an endogenous protein loading control. Protein levels were quantified using fluorescence detection and normalized to β-Actin. Error bars indicate the standard deviation (n=3) (* = p<0.05). Proteins analyzed were A) E-Cadherin, B) p-Akt, C) Bcl-2 and D) Sit3.

