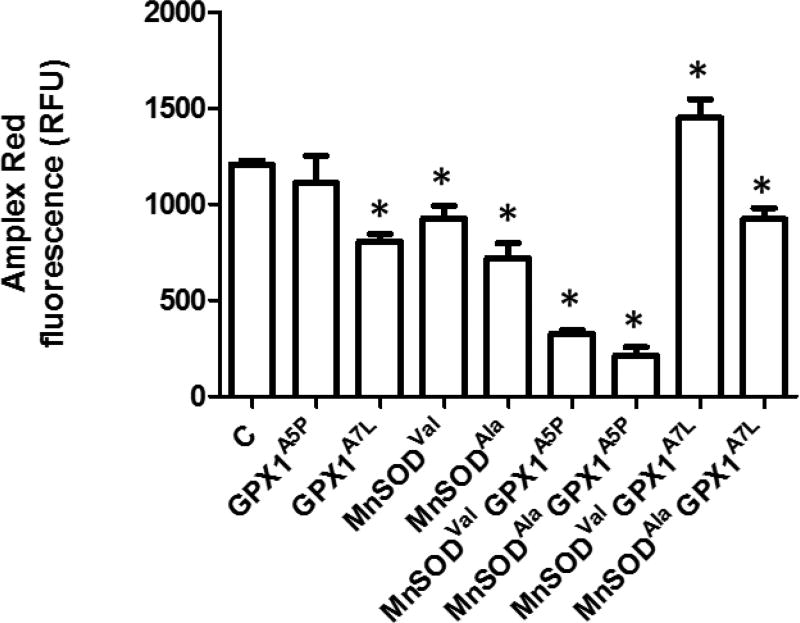
Figure 3. H2O2 levels in cells expressing GPX1A7L and MnSOD variants.
H2O2 levels were assessed in the transfectants using the Amplex Red indicator. Fluorescence was quantified and normalized to protein content as determined using the BCA protein assay. Error bars indicate the standard error (n=4) (* = p<0.05).

