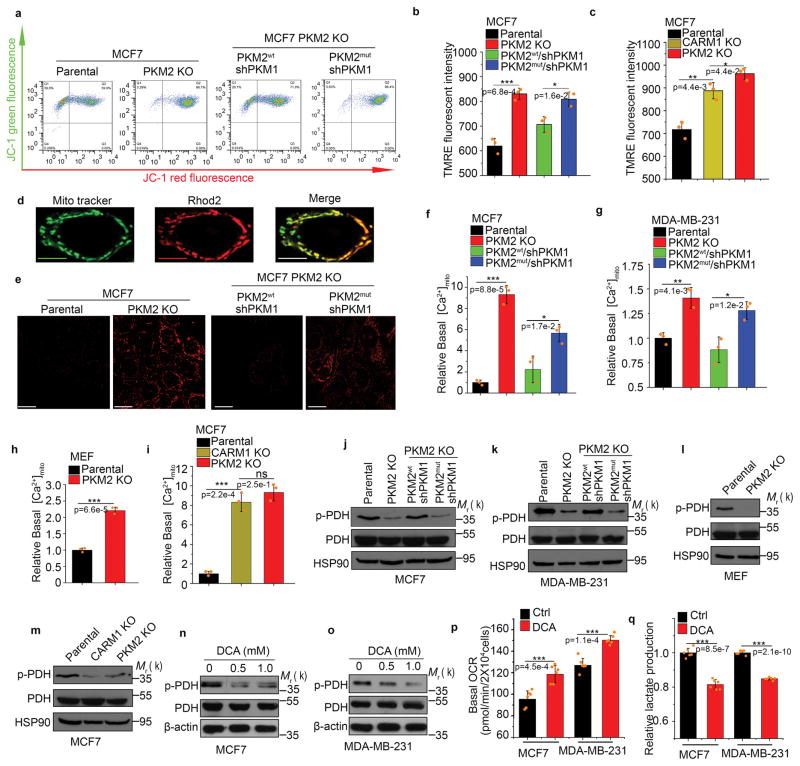
Figure 5.
Inhibiting PKM2 methylation increases mitochondrial membrane potential and [Ca2+]mito. (a–c) Measurement of mitochondrial membrane potential (ΔΨ) by incorporation of JC-1 dye (a) or TMRE dye (b, c) followed by flow cytometry. The ΔΨ was measured by incorporation of JC-1 (a) or TMRE dyes (b) in parental MCF7, PKM2 KO, PKM2wt/shPKM1 and PKM2mut/shPKM1 cells (n=3 independent experiments). Alternatively, the ΔΨ was measured by TMRE dye incorporation in parental MCF7, PKM2 KO and CARM1 KO cells (c) (n=3 independent experiments). (d) Representative images of co-localized mitochondrial tracker and Rhod-2 in MCF7 PKM2 KO cells. Scale bars, 5μm. (e) Representative images of Rhod-2-labeled mitochondria in parental MCF7, PKM2 KO, PKM2wt/shPKM1 and PKM2mut/shPKM1 cells. Scale bars, 10μm. (f–i) Relative basal [Ca2+]mito in Rhod-2-labeled parental, PKM2 KO, PKM2wt/shPKM1 and PKM2mut/shPKM1 MCF7 (f) (n=3 independent experiments) or corresponding MDA-MB-231 cells (g) (n=3 independent experiments); or parental MEF and PKM2 KO cells (h) (n=3 independent experiments); or parental MCF7, CARM1 KO and PKM2 KO cells (i) (n=3 independent experiments). (j–m) Western blotting of phosphorylated PDH and total PDH in indicated MCF7 (j) or corresponding MDA-MB-231 cells (k); or parental MEF and PKM2 KO (l); or parental MCF7, CARM1 KO and PKM2 KO cells (m). (n, o) Western blot analysis of phosphorylated PDH and total PDH in MCF7 (n) or MDA-MB-231 (o) cells treated with DCA. (p, q) Basal OCR (p) and lactate production (q) normalized to the cell numbers in MCF7 or MDA-MB-231 cells treated with DCA (n=6 independent experiments). In b, c, f–h and p–q, data are shown as Mean ±SD and statistics source data are available in Supplementary Table 7. Statistical significance was assessed using two-tailed t-test (h, p and q) and ANOVA (b, c f, g and i), *p<0.05, **p<0.01, ***p<0.001. In d and e, data represent one of the two independent experiments with similar results. In a and j–o, data represent one of the three independent experiments with similar results. Unprocessed original scans of blots are shown in Supplementary Figure 9.

