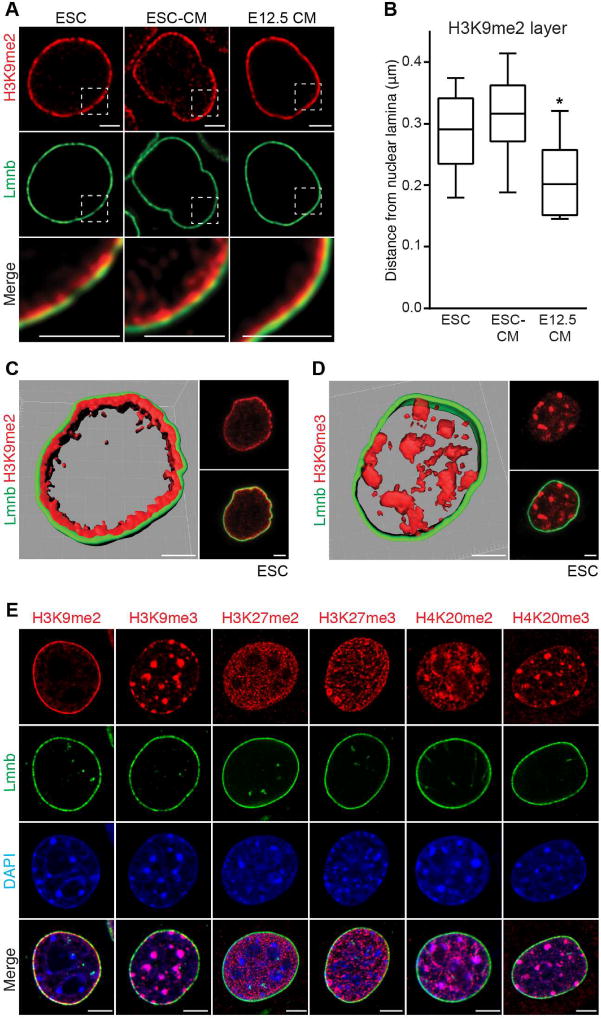
Figure 3. H3K9me2 marks peripheral heterochromatin.
(A) H3K9me2 and Lamin B (Lmnb) immunostaining of indicated cell types. Areas in dotted boxes highlighted in bottom row. (B) Depth of H3K9me2-marked layer of chromatin at nuclear lamina in indicated cell types. 30 locations measured in each cell type, plot shows median distance with Tukey confidence intervals. Analyzed by one-way ANOVA Kruskal-Wallis Test. (C, D) H3K9me2 (C) or H3K9me3 (D) alongside LaminB IF and 3D reconstruction of Z-stack of images in pluripotent ESCs; scale bars: 2.5 µm. (E) IF of skeletal myoblasts with indicated repressive chromatin marks and LaminB. See Fig. S3, Table S4.

