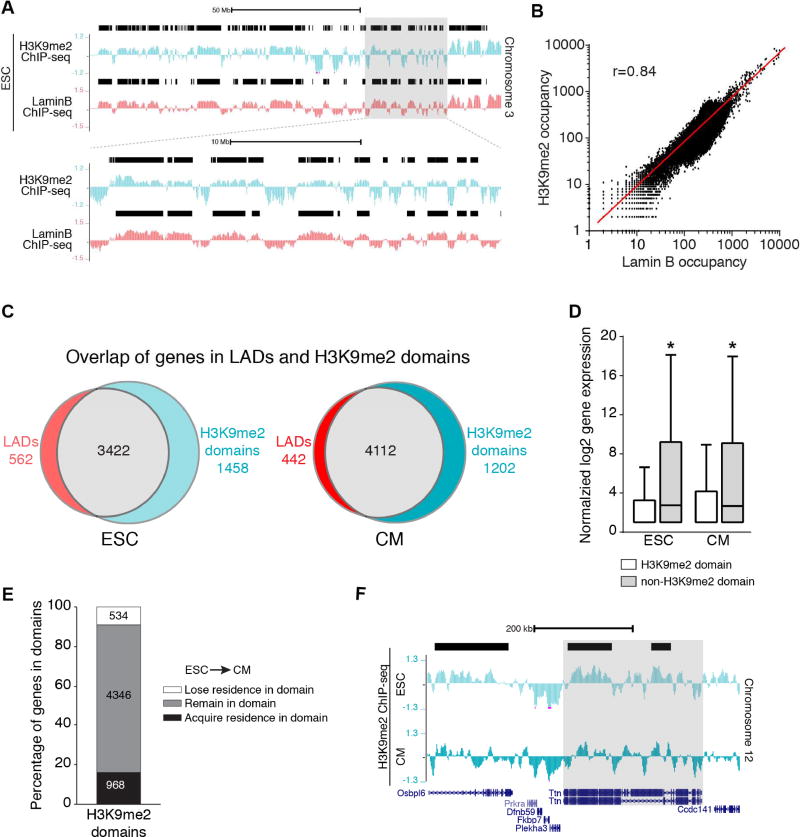
Figure 4. H3K9me2-marked chromatin mirrors lamina bound chromatin.
(A) Representative H3K9me2 and LaminB ChIP-seq tracks from ESCs (Chr 3). Black bars represent LADs. Area in gray box is magnified below top set of tracks. (B) Correlation of LaminB and H3K9me2 occupancy in the genome in 10 kb bins; Pearson’s correlation r = 0.84. (C) Overlap of genes in LADs and H3K9me2 domains. (D) Distribution of normalized log2 gene expression (Wamstad et al., 2012) of genes in H3K9me2 domains and non-H3K9me2 regions in ESC and CMs; median expression with Tukey confidence intervals; significance determined with one-way ANOVA Kruskal-Wallis Test. (E) Number of genes that acquire, remain, or lose residence in H3K9me2 domains in CMs compared to ESCs. (F) H3K9me2 ChIP-seq tracks in ESC and CMs, highlighting Ttn losing residence in a H3K9me2 domain (black bar) in CM compared to ESC. See Fig. S4, Table S2.

