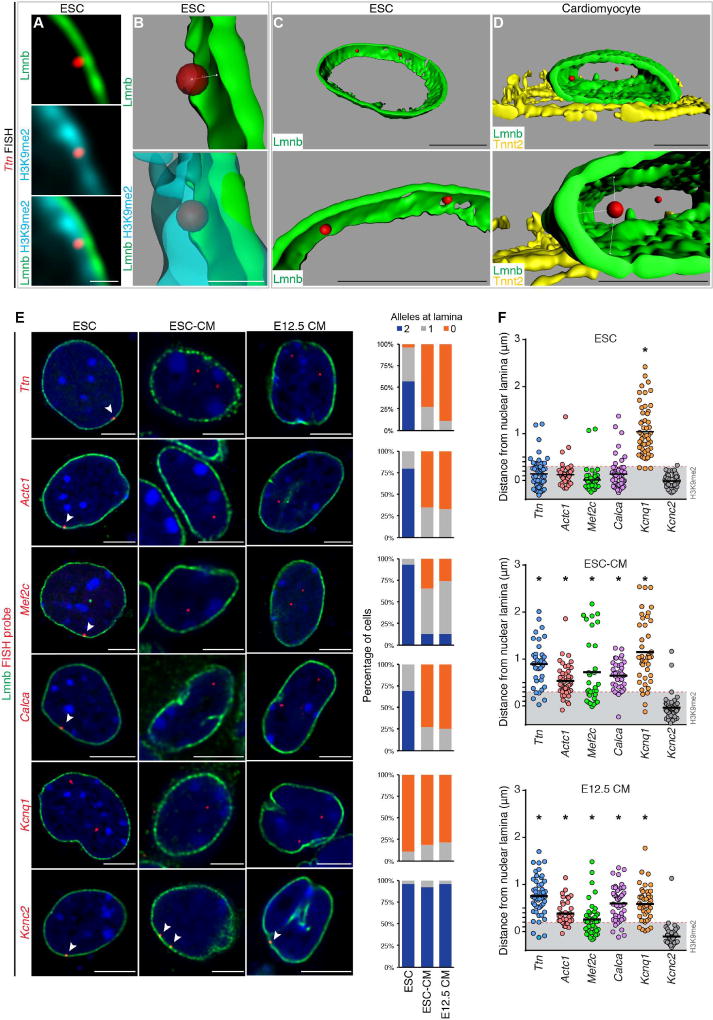
Figure 5. Cardiac genes are released from the nuclear lamina during cardiac differentiation.
(A–C) Immunostaining (A) and 3D reconstruction (B, C) showing Ttn locus in relation to nuclear lamina and H3K9me2-marked chromatin in ESC. (D) 3D reconstruction showing Ttn locus in relation to nuclear lamina in CM. Bottom panels in (C, D) are higher magnification, slightly rotated images, demonstrating distance of each Ttn allele from lamina (Lmnb). Ttn is located further away from the nuclear periphery in CM (C versus D). (E) Immuno-FISH of indicated loci (red) in each cell type co-stained for LaminB (Lmnb). Number of alleles per cell per locus shown adjacent to immuno-FISH images; 20–30 cells were quantified per condition per locus. Thresholding: see methods. (F) Quantitation of distance (E) performed on an individual locus basis in each cell type as indicated. Scale bars: (A, B) 0.5 µm; (C–E) 5 µm. * p< 0.001. Statistical comparisons analyzed by (E) Fisher’s Exact test; (F) one-way ANOVA with a Tukey post-hoc test, comparisons shown in reference to Kcnc2 loci. See Fig. S5, Table S5.

