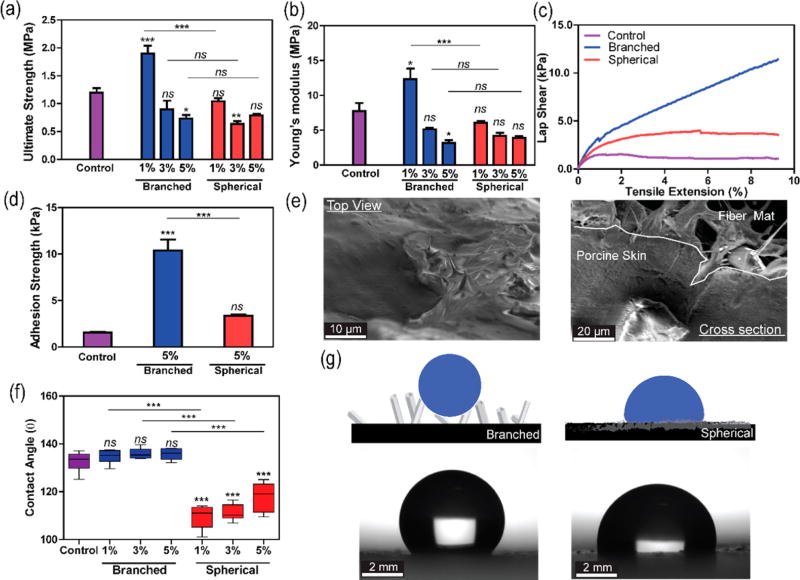
Figure 3.
Mechanical and surface characterization of the nanocomposite structures. (a) Comparison of ultimate strength among the control sample (PCL), branched, and spherical composite scaffolds. The reports of statistical analysis placed directly on top of the bars refer to the comparison of the sample with the control (pristine PCL). The comparison between different samples is shown by lines. (b) Comparison of constructs’ Young’s modulus. (c) Representative lap shear curves of scaffolds sandwiched between porcine skins. (d) Comparison of the adhesion strength of different composite structures (data is derived from lap shear tests with porcine skin). (e) Representative SEM images from top and cross-sectional view of a branched composite material after failure during lap shear test. (f) Measurements of contact angle between a deionized water drop and the material surfaces. (g) Schematic illustration of fibrous structures wetting behavior (top). coupled with optical imaging analysis (bottom) (n = 4 for ultimate strength and Young’s modulus data, n = 3 for adhesion strength data, and n = 6 for contact angle data, *: P < 0.33, **: P < 0.002, ***: P < 0.001).

