
Fig. 5.
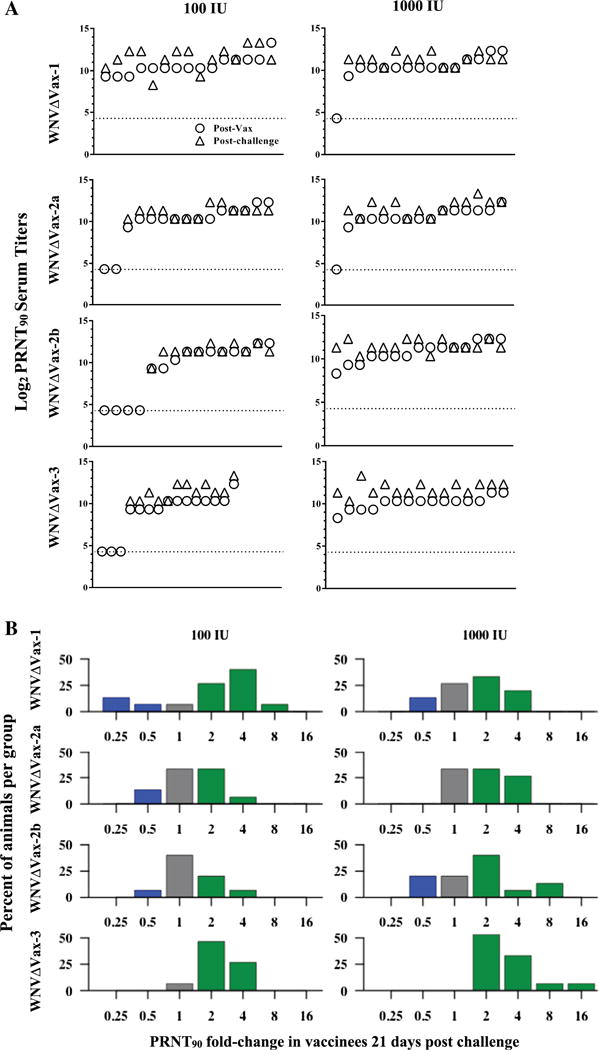
PRNT90 titers in mice after vaccination and after challenge. (A) Mouse sera were tested by PRNT90 assay at 21 days post vaccination (circles) then challenged, and serum was tested subsequently by PRNT90 at 21 days post challenge (triangles). Each stacked pair represents an individual mouse and the x-axis distribution for each graph represents individual mice from 1 (far left) to 15 (far right). Mice whose titers fell below the limit of detection (20 PRNT90, ~4.5 log2 PRNT90) are reported here at the limit of detection, indicated by the dotted line. (B) Fold-change titers from Fig. 4A from 21 days post-vaccination to 21 days post-challenge were compared. Green bars represent groups of animals whose titers increased (>1-fold-change), grey bars represent groups of animals with no change in titer (=1-fold-change), and blue bars represent groups of animals with a decrease in titer (<1-fold-change) after challenge. (For interpretation of the references to color in this figure legend, the reader is referred to the web version of this article.)