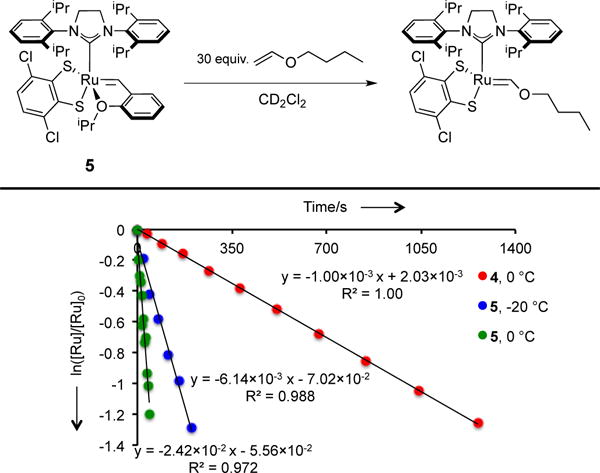
Figure 4.

Plot of ln([Ru]/[Ru]0) versus time for initiation experiments conducted with catalysts 4 and 5 at 0 °C and −20 °C monitored by disappearance of the benzylidene signal by 1H NMR. Plots remain approximately linear for three half-lives of the reaction.
