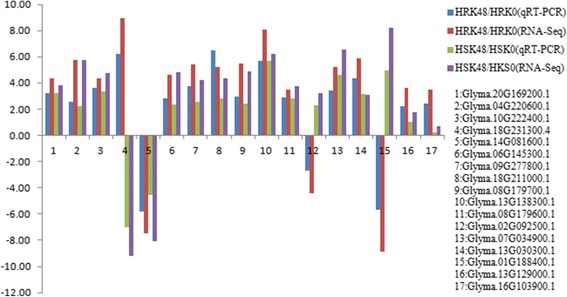
Fig. 8.

DEGs confirmed by qRT-PCR using the same sample as that in RNA-Seq. X-axis represented gene name, the blue column represented qRT-PCR results in HRK48/HRK0, the red column represented RNA-Seq results in HRK48/HRK0, the green column represented qRT-PCR results in HSK48/HSK0, and the purple column represented RNA-Seq results in HSK48/HSK0; Y-axis represented the relative level of gene expression
