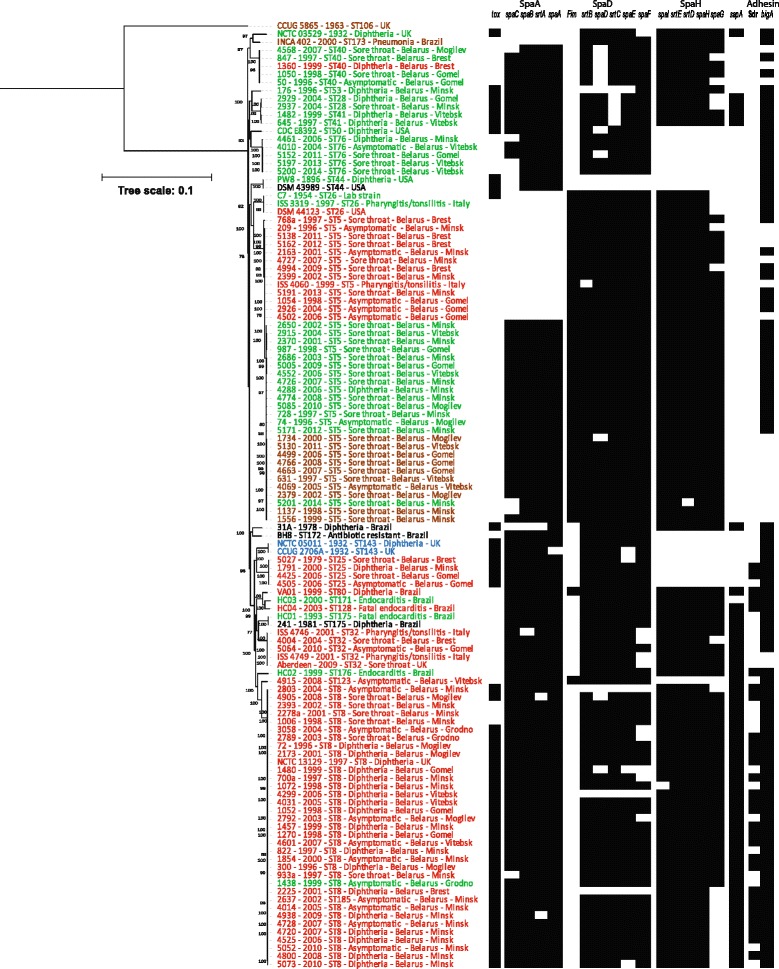
Fig. 1.

A maximum-likelihood tree derived from concatenated nucleotide sequenced alignment of the core genome. The scale bar represents nucleotide substitutions per nucleotide site. The strain designations of isolates of biovar belfanti, gravis, intermedius and mitis are presented in brown, red, blue and green colour, respectively. The presence of virulence genes is mapped on the tree in black whereas a white box shows the absence of genes
