Fig. 5.

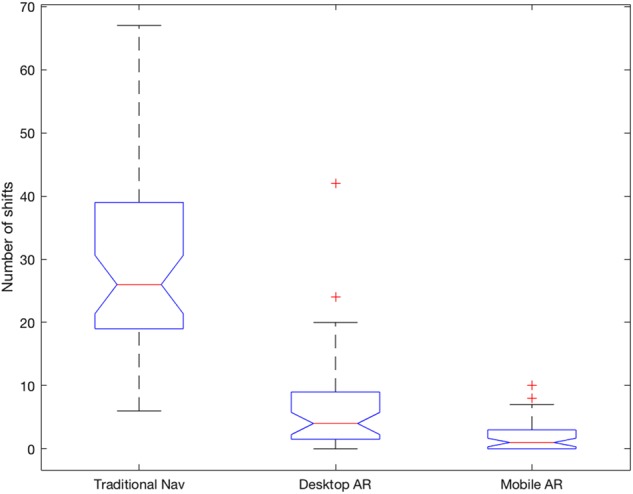
Boxplots of the number of attention shifts per condition. The average number of attention shifts were , and for traditional nav, desktop AR and mobile AR, respectively

Boxplots of the number of attention shifts per condition. The average number of attention shifts were , and for traditional nav, desktop AR and mobile AR, respectively