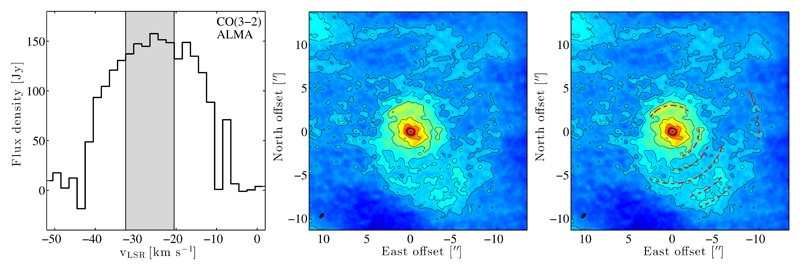
Fig. 1.
Left: ALMA CO(J = 3→2) emission line at 2 km s−1 spectral resolution. The dip at vLSR=-10 km s−1 is due to a bad channel (see Appendix) and is not a real feature. The grey shaded area shows the averaged velocity range to create the image to the right. Middle: Image average of the central channels of the line (grey shaded area in left plot). The image shows arc-like structures and increased emission on the south-west and west sides of the star. Black contours are drawn at 5, 10, 20, 30, and 40σ (where σ is measured over the emission-free channels). The white contours show the position of the AGB star from the continuum emission at 345 GHz. The beam is drawn in the lower left corner. Right: Same as middle image with arcs outlined by red dashed lines.

