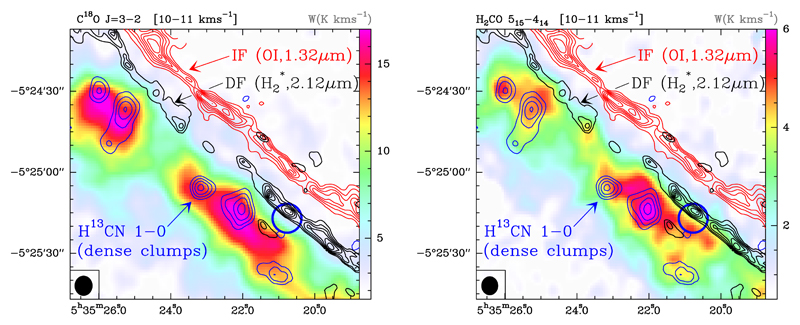
Fig. 1.
C18O J = 3 → 2 (left panel) and H2CO JKa,Kc = 51,5 → 41,4 (right panel) line integrated intensity maps (W in K km s−1) in the 10 − 11 km s−1 velocity interval observed with the IRAM 30 m telescope at ~329 GHz and ~351 GHz, respectively (colour scale). Black contours are the υ = 1 → 0 S (1) emission delineating the H2 dissociation front (DF, Walmsley et al. 2000). The red contours represent the O i fluorescent line at 1.32 µm (Walmsley et al. 2000) marking the position of the ionisation front (IF) that separates the H ii region and the neutral cloud. The blue contours represent the H13CN J = 1 → 0 emission tracing dense molecular clumps inside the Bar (Lis & Schilke 2003). The target position of the Orion Bar survey, close to the DF, is indicated with a blue circle. The IRAM 30 m beam at 1 mm is plotted in the bottom left corner (black circle).

