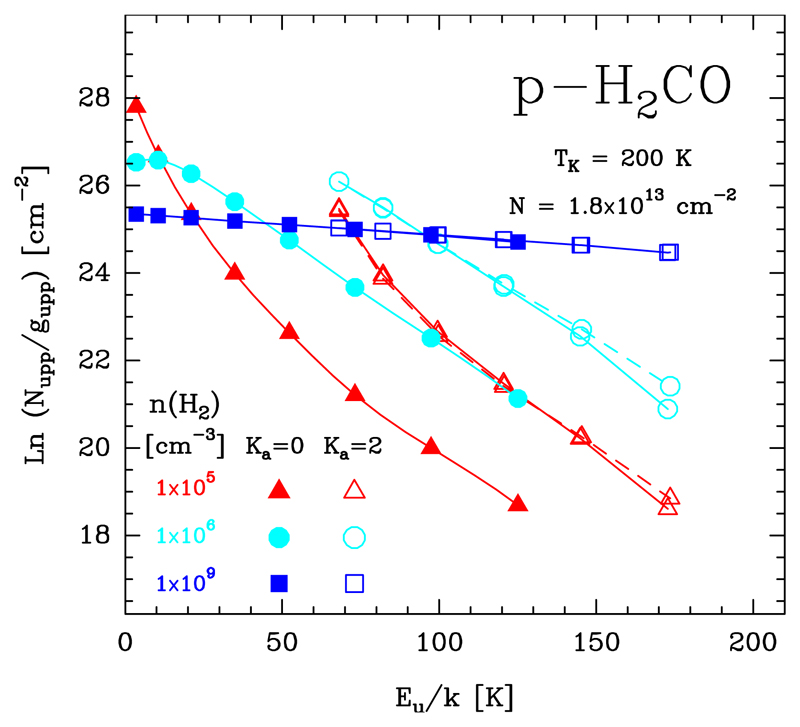
Fig. 17.
Rotational population diagrams for p-H2CO computed with a non-LTE excitation code. All models adopt the same gas temperature (Tk = 200 K) and column density (Ntot = 1.8 × 1013 cm−2), but three different n(H2) values. For simplicity, only rotational transitions in the Ka = 0 (filled symbols) and 2 (empty symbols) ladders are shown. We note that at densities <108 cm−3, the set of transitions with the Ka = 2 number are also split into two components: (i) transitions with Kc = J − 1 (empty symbols connected with solid lines) and (ii) transitions with Kc = J − 2 (empty symbols connected with dashed lines).

