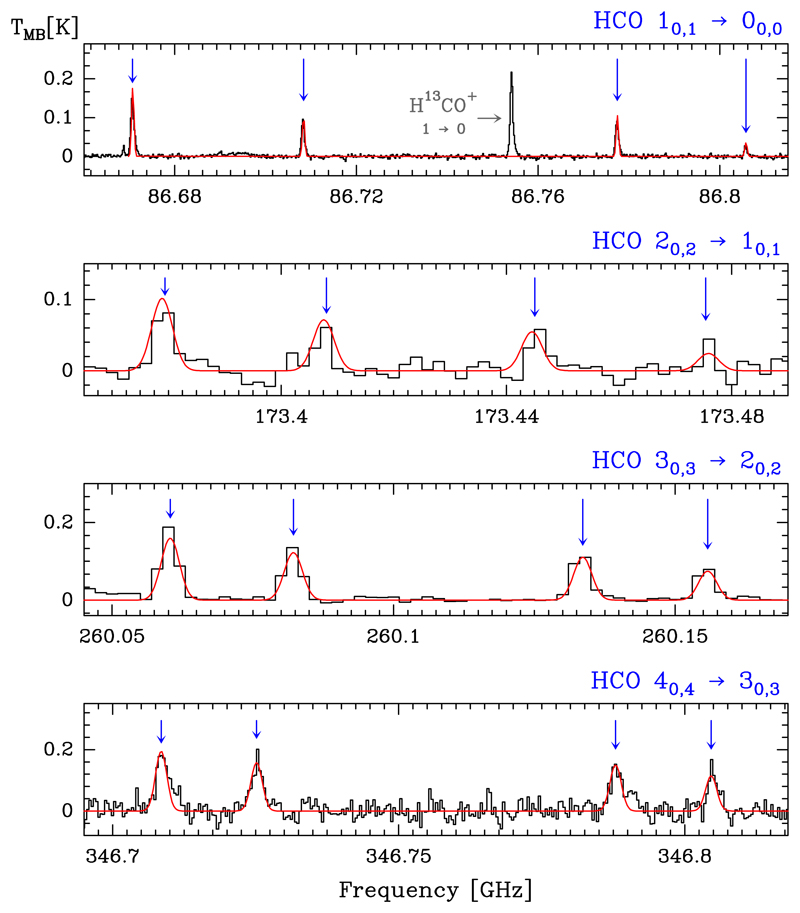
Fig. 2.
Detected HCO hyperfine structure (HFS) lines of the N = 1 → 0, 2 → 1, 3 → 2, and 4 → 3 rotational transitions (black histogram spectra). A single excitation temperature model is shown overlaid in red (see Sect. 5.4). HFS lines are indicated by the blue arrows. The other spectral features appearing in the selected windows are labelled with their corresponding identification.

