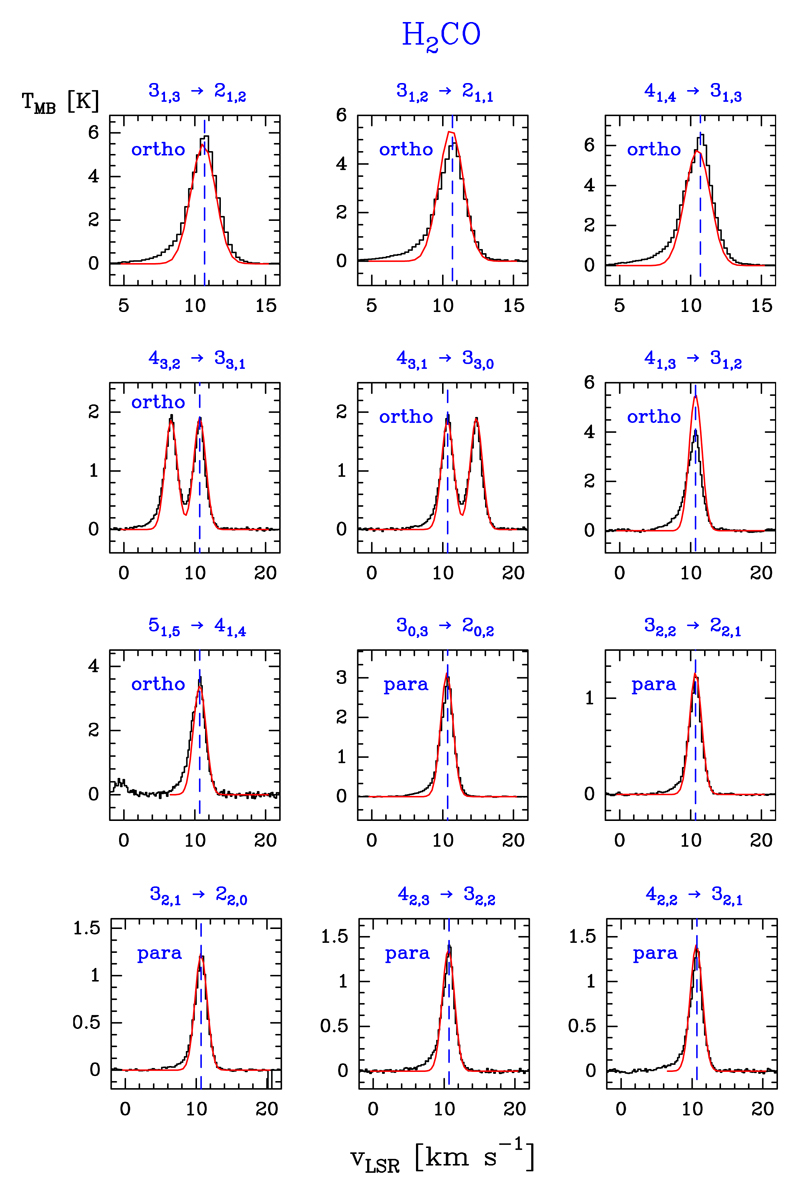
Fig. 3.
Example of ortho- and para-H2CO lines (black histogram spectra). A non-LTE LVG model (Tk ≃ 200 K, n(H2) ≃ 1 × 106 cm−3, N(o-H2CO) = 4.0 × 1013 cm−2, and N(p-H2CO) = 1.8 × 1013 cm−2) is shown overlaid in red (see Sect. 5.2). The dashed lines indicate the LSR velocity (10.7 km s−1) of the Orion Bar PDR.

