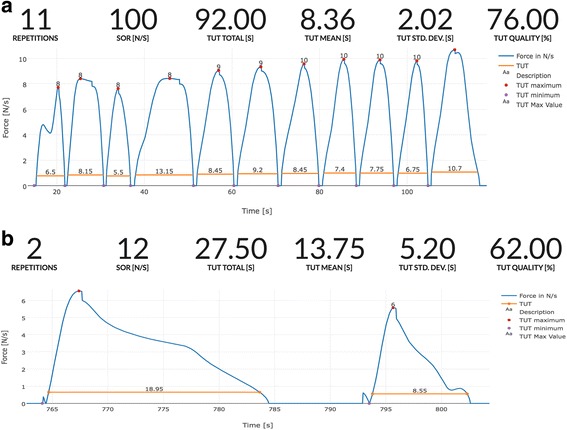
Fig. 4.

Two examples of individual training data. One exercise set performed close to that prescribed (a) and one very far from that prescribed (b). The blue curve indicates the force exerted during single repetitions. The time-under-tension (TUT) for each repetition is marked by the horizontal orange lines. Above the traces, a summary of the data from the BandCizer is shown. In the top panel, exercises performed close to that prescribed are shown. The 11 repetitions are close to the recommended 10 repetitions per set (repetitions). Likewise, the average time-under-tension is close to the prescribed 8 s per repetition (TUT mean (second)). In the lower panel, a performance far from that prescribed is shown. The two repetitions are far from the prescribed 10 repetitions per set (repetitions). Likewise, the average time-under-tension is far from the prescribed 8 s per repetition (TUT mean (second)). (Screendump from BandCizer Backend)
