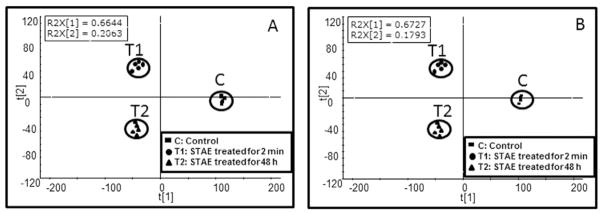
Fig. 1.
The scores plot from PLS-DA analysis of LC/MS data in positive (A) and negative (B) ionization modes from cell extracts after treatment with water (control) and 50 mg/mL STAE, incubated for 2 min or 48 h. Four and five replicates were included in controls and two STAE treated groups, respectively. Notes: C: control; T1: STAE treated for 2 min; T2: STAE treated for 48 h.

