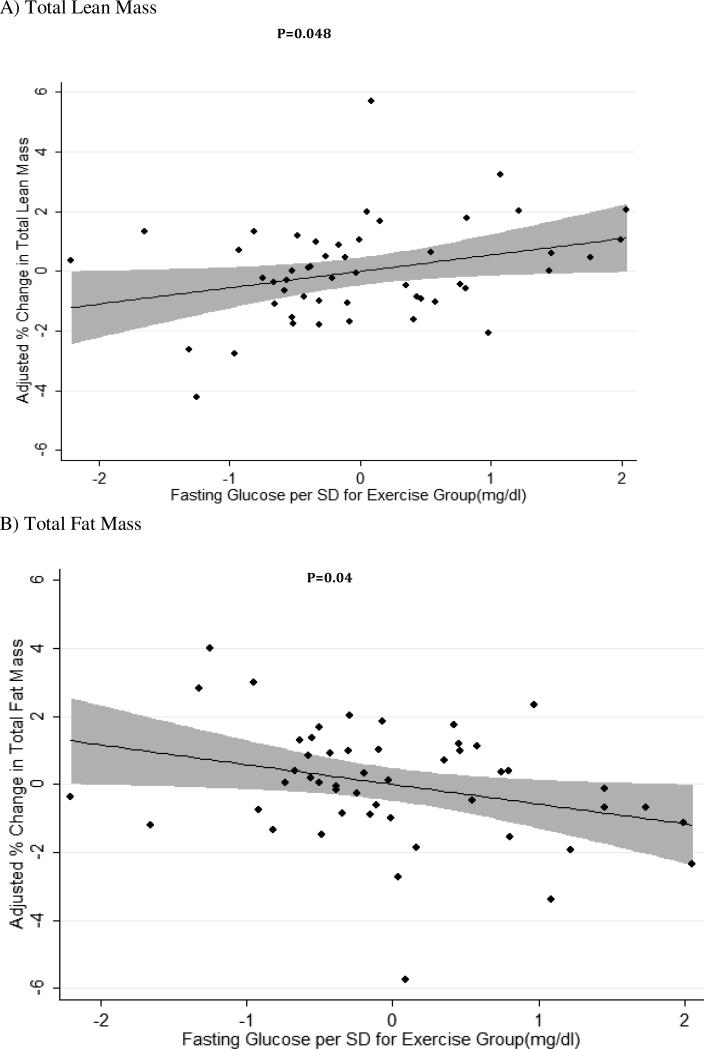
Figure 1. Adjusted % change in total lean body and fat mass, per increase in standard deviation of baseline fasting glucose, after exercise training.
Figure 1A: Adjusted change in % total lean mass body mass after exercise per change in standard deviation of baseline fasting blood glucose from the mean (mean =135.48 mg/dl; SD=39.0 mg/dl) (beta coefficient = 0.54 ± 0.26 % per SD of glucose (mg/dL), p = 0.048).
Figure 1B: Adjusted change in % total body fat after exercise per change in standard deviation of baseline fasting blood glucose from the mean (mean =135.48 mg/dl; SD=39.0 mg/dl) (beta coefficient = -0.57 ± 0.27 % per SD of glucose (mg/dL) , p = 0.04).

