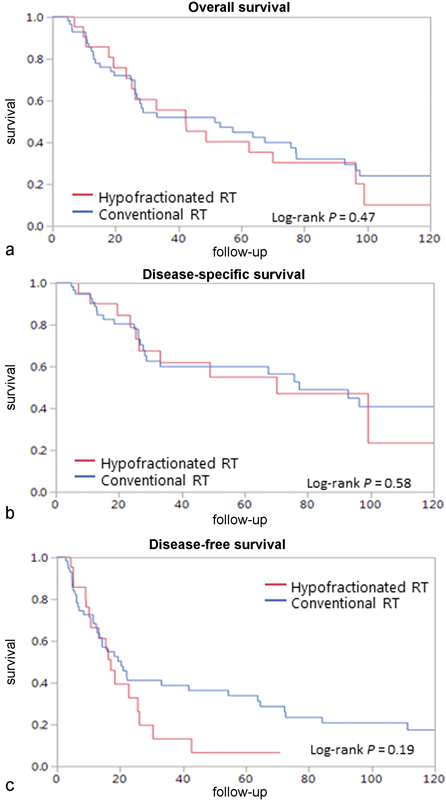
Fig. 3.

Ten-year Kaplan–Meier analysis of outcome of patients undergoing postoperative radiotherapy according to fractionation of treatment by ( a ) overall survival, ( b ) disease-specific survival, and ( c ) disease-free survival. Hypofractionated RT: red line ; conventional RT: blue line . RT, radiotherapy.
