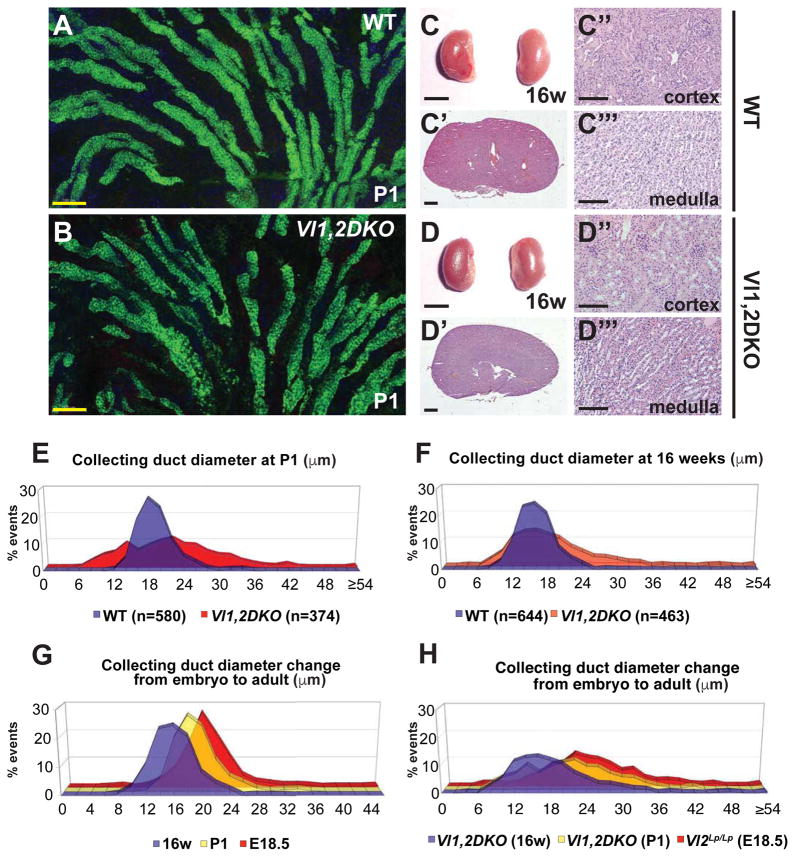
Figure 4. Phenotype of Vangl1,2 DKO kidneys at P1 and 16 weeks.
(A–B) Longitudinal sections of WT control and Vangl1,2 DKO collecting ducts stained for AQP2 (marking lumens) showing more irregular diameter of the Vangl1,2 DKO ducts along their lengths. Samples are 30 μm thickness. See also Movies S1 and S2. (C–C″) Gross, and H&E sections of WT control and (D–D″) Vangl1,2 DKO mutant kidneys showing absence of cysts. (E–F) Distribution plots of collecting duct diameters of WT and Vangl1,2 DKO at P1 and 16 weeks, measured with standard fixation, showing broader distribution in Vangl1,2 DKO compared to WT. (G–H) Distribution plots of collecting duct diameters showing reduction in overall diameters from E18.5 to 16 weeks in both WT and mutant ducts. Scale bars: A,B,C″,C‴,D″,D‴, 100 μm; C,D, 5 mm; C′,D′, 1 mm. See also Figure S4 and Table S1.

