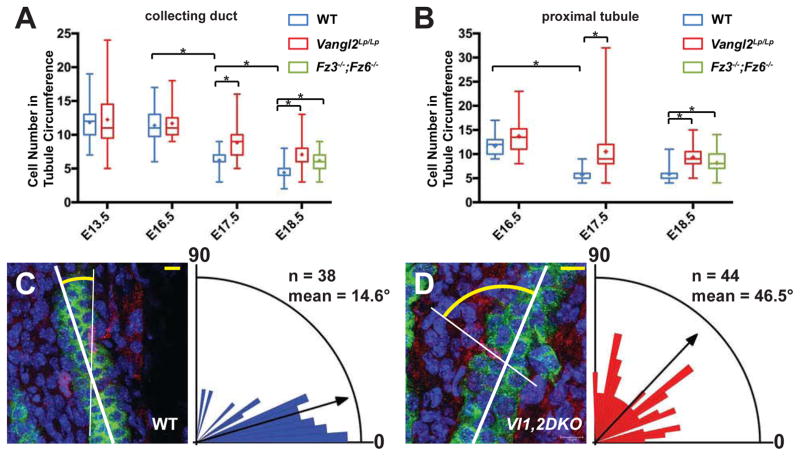
Figure 5. CE and OCD in WT and Vangl1,2 DKO collecting ducts.
(A–B) Cell number ± SEM per tubule cross-section at the indicated stages in WT control, Vangl2Lp/Lp and Fz3−/−; Fz6−/−collecting ducts and proximal tubules, showing a slowed decrease in mutants compared to WT. Box and whisker format shows the minimum, lower quartile, median, upper quartile and maximum values; + indicates mean. * = p<0.0001 by Mann-Whitney U test. (C–D) Orientation of cell divisions in WT control and in Vl1,2DKO collecting ducts assayed using the histone H3 immunolabeling method[10], quantified at P1. Difference between WT control and Vl1,2DKO is significant at p<0.0001 by Mann-Whitney U test. Representative images showing cell divisions labeled for AQP2 (green; collecting duct), histone H3 (red; dividing nuclei) and DAPI (blue; all nuclei). See also Movies S1, S2 and Figure S5. Scale bars: 10 μm.

