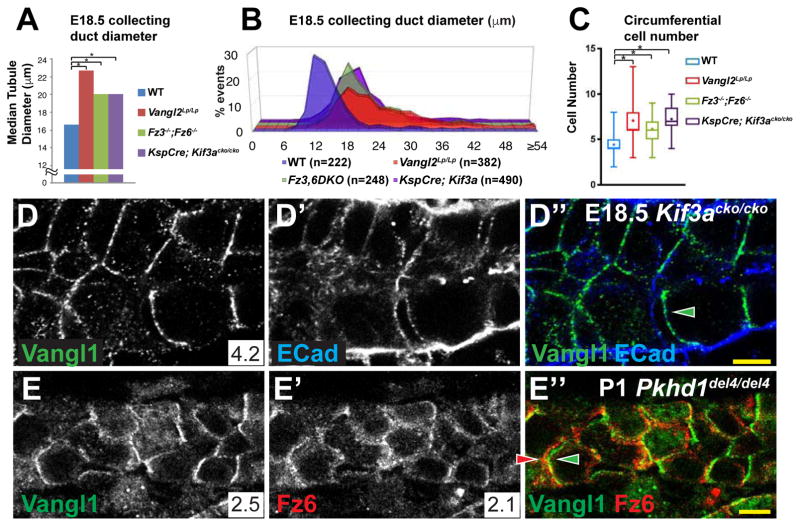
Figure 6. PCP in cystic kidneys.
(A) Median collecting duct diameters at E18.5 for WT control, Vangl2Lp/Lp, Fz3−/−; Fz6−/− and KspCre;Kif3acko/cko. Data for WT control, Vangl2Lp/Lp, Fz3−/−; Fz6−/− are from figure 1H. For KspCre;Kif3acko/cko, median = 20.1 μM and * = p<0.0001 compared to wildtype by Mann-Whitney U test. (B) Distribution plots of the measurements from (A). (C) Circumferential cell number for E18.5 collecting ducts for WT control, Vangl2Lp/Lp, Fz3−/−; Fz6−/− and KspCre;Kif3acko/cko. Displayed in box and whisker format showing the minimum, lower quartile, median, upper quartile and maximum values; + indicates mean. * = p<0.0001 by Mann-Whitney U test. Data for WT control, Vangl2Lp/Lp, Fz3−/−; Fz6−/− are from figure 5A. (D–D″) E18.5 collecting duct from KspCre;Kif3acko/cko precystic kidneys showing asymmetrically localized Vangl1 (green); E-Cadherin (blue). (E–E″) P1 Pkhd1del4/del4 collecting duct showing asymmetrically localized Vangl1 (green) and Fz6 (red). Scale bars: 5 μm. See also Figure S6.

