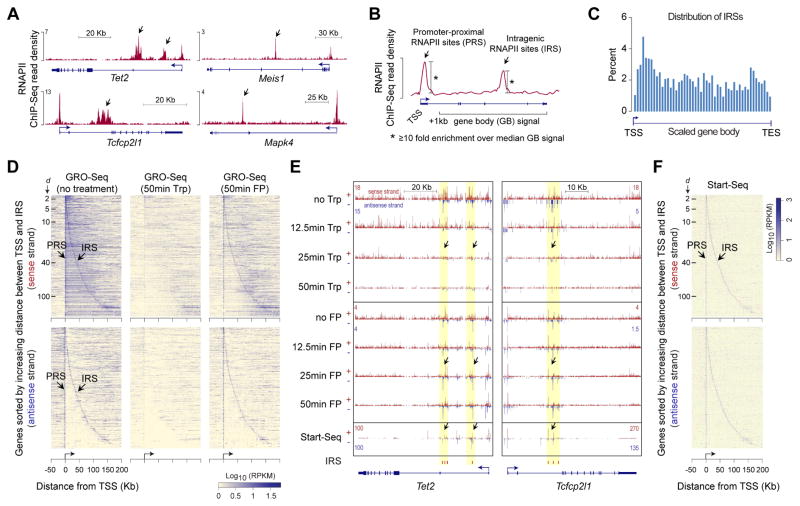
Figure 1. Characterization of intragenic RNAPII sites.
(A) ChIP-Seq profiles of RNAPII occupancy at select genes in mouse ESCs(Brookes et al., 2012).
(B) Schematic describing the calculation used to determine promoter-proximal RNAPII sites (PRSs) and intragenic RNAPII sites (IRSs).
(C) Histogram showing distribution of IRSs within genes.
(D) Heatmap representation of nascent RNA expression, as measured using GROSeq( Jonkers et al., 2014) in untreated mouse ESCs, near IRS-containing genes. Each row represents an IRS-containing gene, with genes aligned at their TSSs. Genes are sorted (top to bottom) by increasing distance between TSS and IRS; The distance (d, Kb) between TSS and IRS is indicated by tick marks. Top and bottom panels, data from sense and antisense strands respectively. About 90% of the IRS-containing genes, with IRSs within 200 Kb of their TSSs, are shown.
(E) Genome browser shots of genes Tet2 and Tcfcp2l1 showing GRO-Seq read density in ESCs treated with Triptolide (Trp) or Flavopiridol (FP) for 12.5, 25, and 50 min(Jonkers et al., 2014) and transcription initiation-associated RNA enrichment in mouse ESCs, as measured using Start-Seq(Williams et al., 2015). IRS loci highlighted in yellow.
(F) Heatmap representation of Start-Seq read density at IRS-containing genes. Data representation is similar to that in (D).
See also Figure S1.

