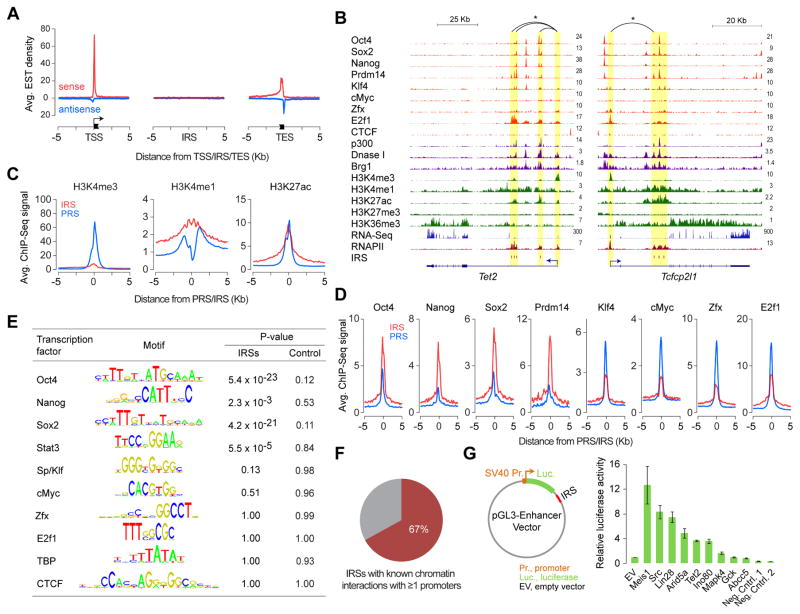
Figure 2. Intragenic sites of RNAPII enrichment mark transcriptionally active intragenic enhancers.
(A) Density plot showing average expressed sequence tag (EST) enrichment at TSSs, IRSs, and transcription end sites (TESs).
(B) Genome browser shots of genes Tet2 and Tcfcp2l1 showing ChIP-Seq read density profiles of RNAPII, various transcription regulators and chromatin remodelers, and histone modifications in mouse ESCs. Also shown are read density profiles for DNase I hypersensitivity and gene expression (RNA-Seq). IRS loci highlighted in yellow. *Known chromatin interactions.
(C) Relative levels (RPKM) of H3K4me3, H3K4me1 and H3K27ac at IRSs and PRSs in mouse ESCs.
(D) Relative binding levels (RPKM) of master ESC TFs Oct4, Sox2, Nanog, and Prdm14 and other TFs (Klf4, cMyc, Zfx, and E2f1) at IRSs and PRSs in mouse ESCs.
(E) Relative enrichment of TF sequence recognition motifs within IRSs or matched intragenic control regions in comparison to promoters.
(F) Percentage of IRSs involved in chromatin interaction with ≥1 promoter.
(G) Left: Reporter construct used for testing enhancer activity. Right: Relative luciferase activity of IRSs or control regions in mouse ESCs. Error bars represent SEM of three biological replicates.
See also Figure S1.

