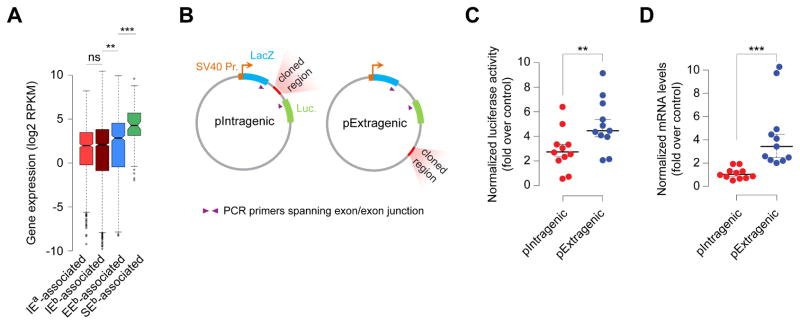
Figure 3. Enhancers in intragenic position attenuate host gene expression.
(A) Expression (Brookes et al., 2012) of genes containing intragenic enhancers (IEs; adefined here; bdefined by Whyte et al (Whyte et al., 2013)), genes closest to (≤10 Kb) extragenic enhancers (EEs) (Whyte et al., 2013) and super enhancers (SEs) (Whyte et al., 2013). **P = 3.46e–5; ***P = 7.63e–8 (Wilcoxon-Mann-Whitney U test; two-sided).
(B) Reporter construct containing two reporter genes lacZ (encoding β-galactosidase) and luciferase, fused with a recombinant fragment containing two exons and a single intron, driven by SV40 promoter. Regions of interest were cloned either within the intron (pIntragenic) or downstream of the reporter gene (pExtragenic).
(C, D) Normalized luciferase activity (C) and mRNA levels of the reporter gene (D) in mouse ESCs from pIntragenic and pExtragenic reporter constructs cloned with intragenic enhancers. **P = 0.00598; ***P = 1.93 × 10⁻⁷ (Wilcoxon-Mann-Whitney U test; two-sided). Data points represent mean of n = 5 to 15 biological replicates. mRNA data, normalized to Actin.
See also Figure S2 and S3.

