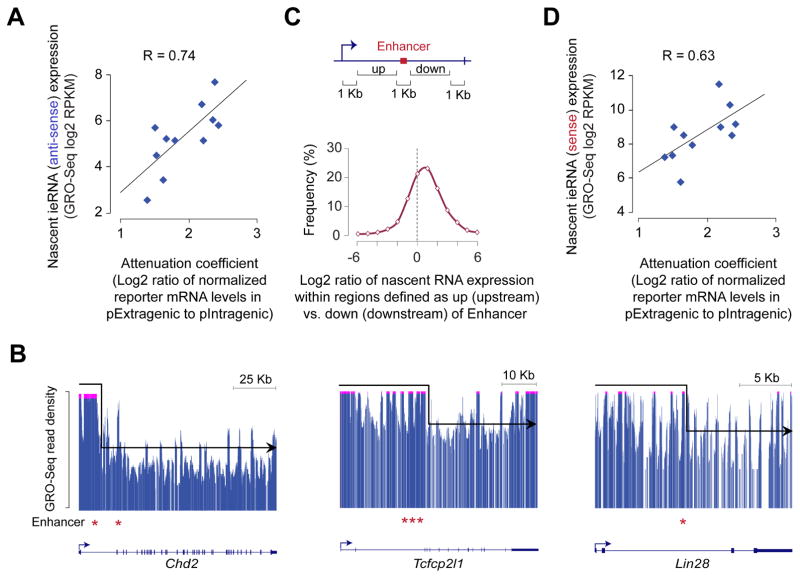
Figure 4. Transcription at intragenic enhancers attenuates host gene expression.
(A) Correlation between attenuation coefficient, calculated based on mRNA data shown in Fig. S3A (summarized as Fig. 3D), and levels of nascent antisense ieRNA expression, assessed from GRO-Seq data in mouse ESCs(Jonkers et al., 2014).
(B) GRO-Seq profiles of nascent RNA at select genes showing relatively higher levels of GRO-Seq signal upstream than downstream of intragenic enhancers (*). GRO-Seq signal (y-axis) above an arbitrary threshold is truncated (pink streak up-top) to highlight the drop-off in the GRO-Seq signal downstream of the intragenic enhancer.
(C) Top: Schematic showing intragenic regions defined as upstream (up) and downstream (down) of intragenic enhancer. Bottom: Distribution of the ratios of GRO-Seq (Jonkers et al., 2014) read density within the ‘up’ region to that within the corresponding ‘down’ region. Only GRO-Seq reads from the sense strand was used.
(D) Correlation between attenuation coefficient, calculated based on data shown in Fig. 3D, and levels of nascent sense ieRNA expression, assessed from GRO-Seq data(Jonkers et al., 2014).
See also Figure S3.

