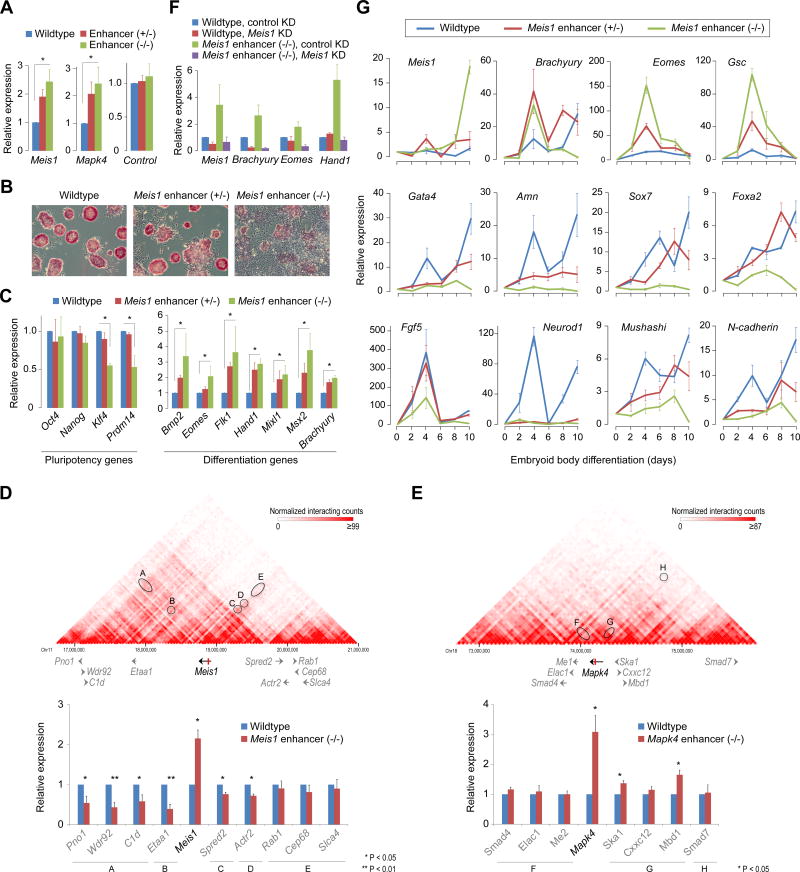
Figure 6. A role for intragenic enhancer-mediated attenuation in cell-fate determination.
(A) RT-qPCR analysis of mRNA levels of intragenic enhancer-containing genes Meis1 and Mapk4 in corresponding wild-type, enhancer heterozygous (+/−) and enhancer knockout (−/−) mouse ESCs. As a control, an intronic region (showing no signs of an enhancer) from Cdk6 gene was deleted and Cdk6 expression was measured. Data are normalized to Actin. Error bars represent SEM of three biological replicates. *P < 0.01 (Student’s t-test; two-sided).
(B) Morphology and alkaline phosphatase staining of wildtype, Meis1 enhancer (+/−) and Meis1 enhancer (−/−) ESCs.
(C) mRNA levels of pluripotency-associated ESC identity genes (left) and differentiation/developmental genes (right) in wildtype, Meis1 enhancer (+/−) and Meis1 enhancer (−/−) ESCs. Data are normalized to Actin. Error bars represent SEM of three biological replicates. *P < 0.05 (Student’s t-test; two-sided).
(D, E) Top: Chromosomal view of Hi-C interaction maps of Meis1 (D) and Mapk4 (E) loci in mouse ESCs(Dixon et al., 2012). Hi-C maps capture all genome-wide interactions, functional as well as structural. Black/gray arrows represent gene structures and the red vertical bar within Meis1 and Mapk4 genes represent intragenic enhancers. Ovals highlight interaction strengths between the regions containing intragenic enhancer and gene promoter(s). Bottom: mRNA levels of genes within Meis1 (or Mapk4) locus in wildtype or Meis1 (Mapk4, respectively) enhancer (−/−) ESCs. Data are normalized to Actin. Error bars represent SEM of three biological replicates.
(F) Depletion of Meis1 in Meis1 enhancer (−/−) ESCs restores the expression of differentiation genes. Data are normalized to Actin. Error bars represent SEM of three biological replicates. *P < 0.05 (Student’s t-test; two-sided).
(G) mRNA levels of early differentiation markers (top row, mesoderm; middle row, endoderm; bottom row, ectoderm) during embryoid body formation of wildtype, Meis1 enhancer (+/−) and Meis1 enhancer (−/−) ESCs. Data are normalized to Actin. Error bars represent SEM of three biological replicates.
See also Figures S5 and S6.

