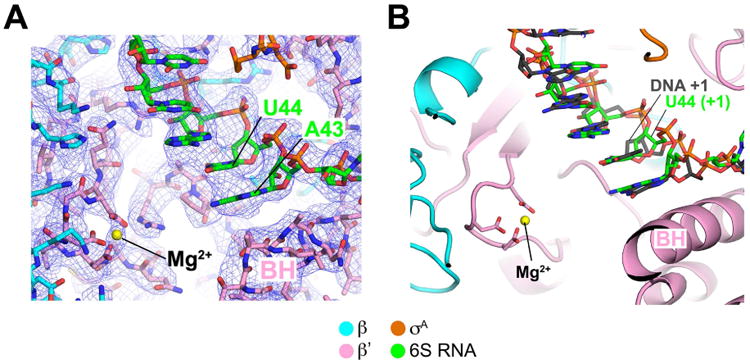
Figure 3. Active-site density and comparison with promoter DNA.

(A) View of the 6S RNA/Eσ70 cryoEM density map (blue mesh) showing the region around the RNAP active site (Mg2+ ion shown as a yellow sphere). The TSS on 6S RNA is U44.
(B) Shown is the 6S RNA/Eσ70 structure near the RNAP active site (Mg2+ ion, yellow sphere). Superimposed on the 6S RNA is the promoter DNA t-strand from the promoter open complex structure (Bae et al., 2015). The TSS on 6S RNA (U44) and promoter DNA (DNA +1) are noted.
