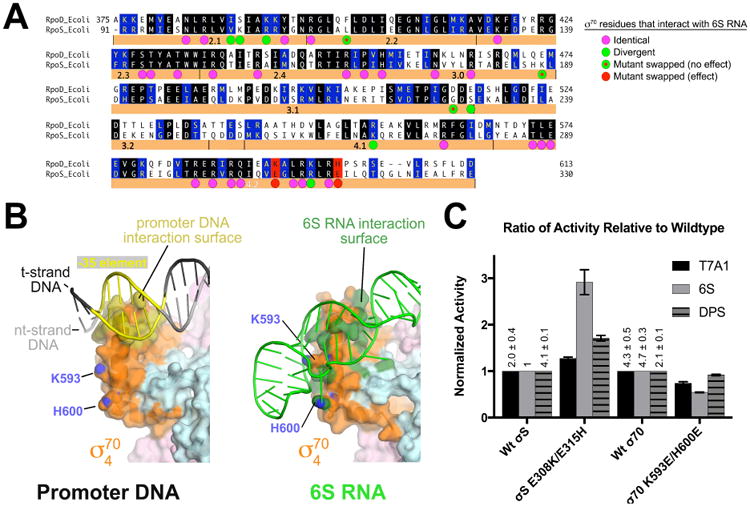
Figure 7. Structural basis for 6S RNA specificity for Eσ70 over EσS.

(A) Sequence alignment of Eco σ70 (RpoD) and σS (RpoS). Identical residues are shaded black, homologous residues shaded blue. Eco σ70 residues that interact with 6S RNA are denoted by a colored dot underneath. The magenta dots indicate positions that are identical between σ70/σS. Green dots indicate positions that diverge in sequence. Green dots with red dots inside are positions that were swapped between σ70 and σS but had no apparent effect on 6S RNA preference (Figure S7). Two loci, denoted in red (σ70 K593/H600; σS E308/E315), altered 6S RNA preference when swapped (see Figure 4C (Klocko and Wassarman, 2009).
(B) Interaction surfaces for promoter DNA (left; PDB ID 5WT1) (Hubin et al., 2017) and 6S RNA (right) on the σ4 domain. The RNAP holoenzyme is shown as a molecular surface (β, light cyan; β′, light pink; σ70, orange). The surface of σ4 that contacts the promoter DNA is colored dark yellow (left). Marked with their blue nitrogen atoms are K593 and H600 (using Eco σ70 numbering), which are solvent-exposed. On the right, the surface of σ704 that contacts 6S RNA is colored dark green, illustrating that K593/H600 are engaged with the 6S RNA.
(C) Histogram showing the normalized abortive transcription initiation activity for the indicated σ's (bottom) on the indicated templates (σ70-specific promoter T7A1; σ70-specific 6S RNA; σS-specific promoter DPS). The σS-holoenzyme activities are shown normalized with respect to wild-type σS, while the σ70-holoenzymes are shown normalized to wild-type σ70. The relative values of the wild-type σ70 and σS transcription activities on the different templates (with respect to 6S RNA with σS) are listed. The histograms represent the average of at least three independent measurements, the error bars denote S.E.M.s. Mutation of σS positions 308 and 315 to the corresponding residues in σ70 (σS E308K/E315H) increased the relative activity on 6S RNA with less effect on the relative activity on the other templates.
See also Figure S7.
