
Figure 1.
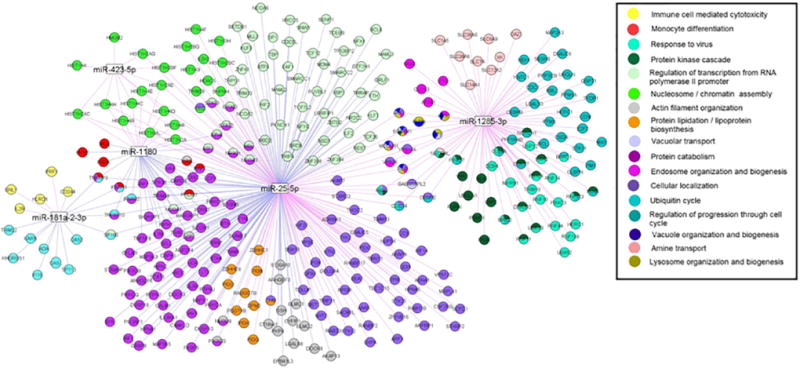
Network of Gene Ontology Categories for Smoking-Associated mRNAs Coexpressed with Smoking-Associated miRNAs. Smoking-associated gene transcripts that are coexpressed with one or more smoking-associated miRNAs and represented by one or more GO categories. Only gene transcripts belonging to GO categories meeting the Bonferroni-corrected enrichment p-value threshold of p<10−5, are included (see Supplementary Tables 3 and 4 for GO results). Blue lines denote negative correlations, while purple lines indicate positive correlations between miRNA and mRNA expression. This figure was drawn by ProteoLens.37