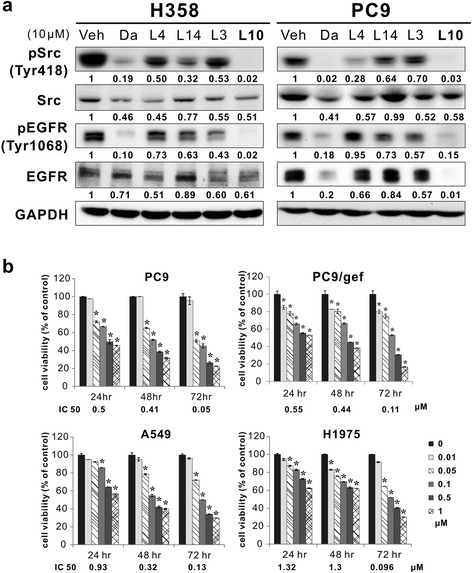
Fig. 1.

Effects of the candidate compounds on Src and EGFR expression and cell viability in different cell lines. a Src and EGFR expression and phosphorylation in H358 and PC9 cells treated with the candidate compounds for 24 h and analyzed by western blotting. Veh (vehicle) represents 0.1% DMSO; Da represents dasatinib, a positive control. GAPDH served as a loading control. Protein expression was quantified by ImageJ software (NIH), and the results are shown directly below the gel graph. b AC-93253 iodide cytotoxicity determined by cell viability assays in NSCLC cell lines with different EGFR statuses. The results are presented as percentages of the vehicle control (0 μM, 0.1% DMSO). The IC50 of the designated time point is indicated at the bottom of each bar chart. Each experiment was performed independently and in triplicate. *P < 0.05 compared with the vehicle control
