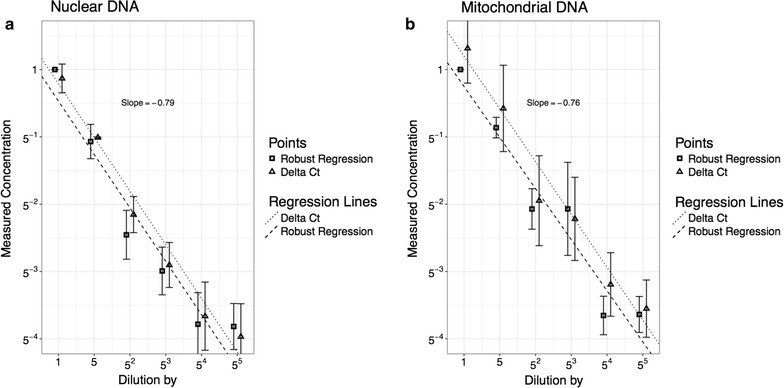
Fig. 2.

Dilution series: DNA concentration in the PCR mix is serialy diluted by a factor 5, six times. The DNA concentration is measured using the robust regression method and the method. Each concentration is prepared in 16 replicas. The same procedure is reproduced for both nuclear and mitochondrial DNA. Regression lines are fitted using the least squared method. The data has been shifted slightly left and right of the true value for illustration purposes
