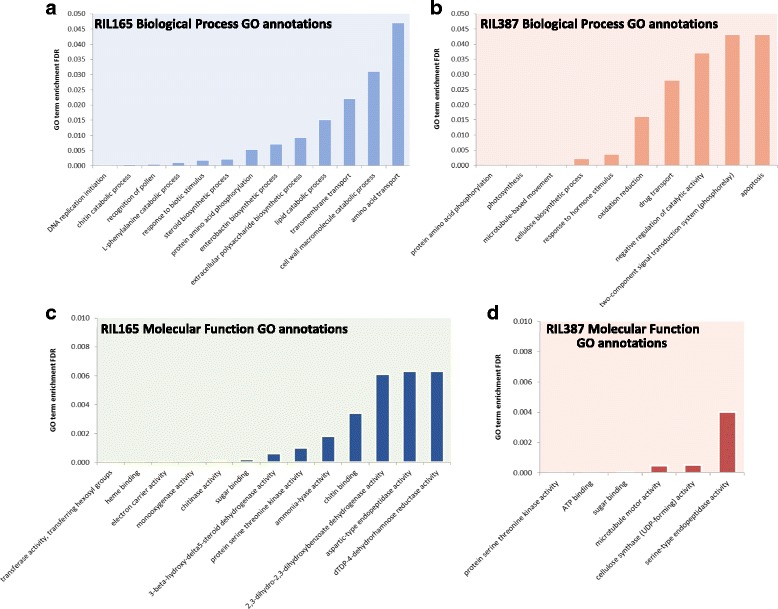
Fig. 3.

Enriched GO annotations for genes with altered expression in RIL165 and RIL387. Significantly enriched GO terms related to biological processes (a and b) or molecular functions (c and d) of the functionally annotated genes with higher expression in RIL165 (blue bars in a and c) or in RIL387 (red bars in b and d). The bars represent the FDR adjusted p-value (y-axis), and therefore the terms on the left-hand side of each graph have the most significant enrichment. Only the specialized child terms from the SEA analysis with FDR adjusted P value ≤0.05, relating to BP and FDR adjusted P value ≤0.01 relating to MF are shown. A list of all significant GO terms is available in Additional file 5
