
Fig. 4.
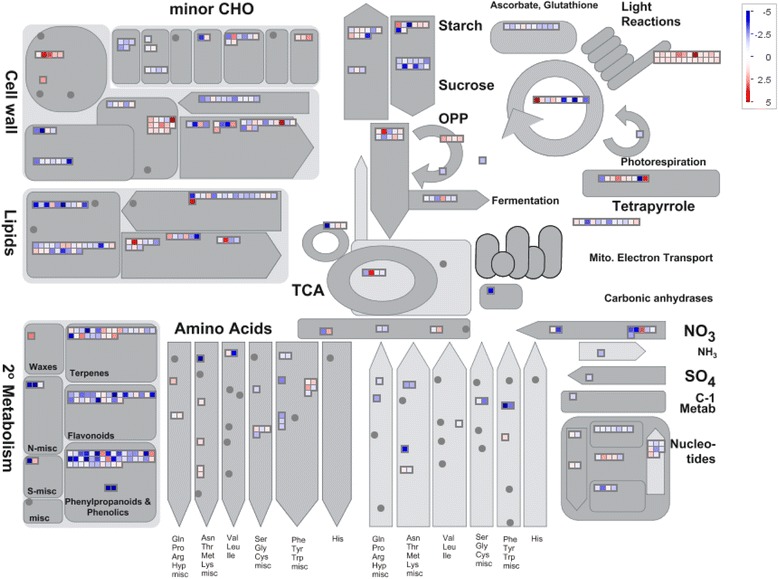
Overview of metabolic changes in RIL165 and RIL387, visualised by MapMan. Each entity within a pathway is depicted by a colour signal where red signifies genes with higher expression in RIL387 compared to RIL165 and blue signifies genes with higher expression in RIL165 compared to RIL387. The intensity of the colour indicates the level of expression [44]. Scale bar displays Log2fold changes. Genes binned to each pathway is available in Additional file 3