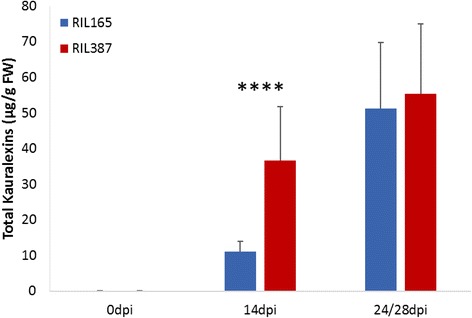
Fig. 5.

Total kauralexin accumulation in RIL165 and RIL387. Average levels (n = 3–5; ±SEM) of total kauralexin metabolites depicted on the primary y-axis in RIL165 and RIL387. Leaves were treated with a spore solution (3 × 10⁵ conidia/ml) and harvested at 0 days post inoculation (dpi), 14dpi and 24 or 28dpi (RIL165 and RIL387 respectively). Asterisks represent significant differences in expression levels between RIL165 and RIL387 (all ANOVAs, P < 0.0001; Tukey test corrections for multiple comparisons, P < 0.05)
