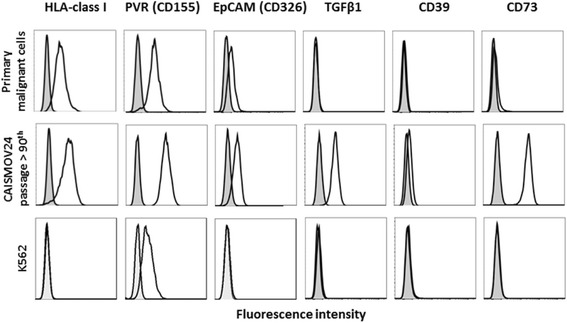
Fig. 3.

Flow cytometric profiles representative of the fluorescence intensity of the molecules, HLA-class I, PVR (CD155), EpCAM (CD326), TGF-β1, CD39 and CD73, comparing the expression of these surface molecules between the CAISMOV24 cell line and its primary malignant cells. The cells were incubated with appropriate concentrations of fluorochrome-conjugated monoclonal antibodies. After incubation, cells were washed with PBS and the final cell pellets suspended for acquisition, using a FACS Verse flow cytometer. The K562 cell line was employed as a negative control for most of the surface molecules assessed in this assay
